


US Equities Outlook:
- With the Fed taper debate heating up as delta variant concerns balloon, US stock markets are beginning to exhibit early signs of technical weakness.
- The US S&P 500 may experience a deeper pullback if it loses the daily 21-EMA, back to its 50-SMA, while the US Russell 2000 has already slipped below its pandemic trendline.
- According to the IG Client Sentiment Index, the US S&P 500 has a bearish trading bias in the short-term.

US Stocks Ease From Record Territory
It’s been a few good months for US stock markets. We’ve seen fresh record highs in the Dow Jones Industrial Average and the Nasdaq 100 (old school stocks and new school stocks, respectively, as Strategist Paul Robinson notes), as well as the S&P 500.
But there are early warning signs of technical weakness on the horizon as delta variant concerns ball. The Russell 2000, an index weighted more heavily towards small-caps – and thus the economy re-opening post-pandemic – has already started to slip below its pandemic trendline. If the S&P 500 loses its daily 21-EMA, another drop back to its 50-SMA could materialize quickly.
US RUSSELL 2000 (ETF: IWM; CFD: RUT) TECHNICAL ANALYSIS: DAILY CHART (March 2020 to August 2021) (CHART 1)

The small-cap heavy Russell 2000 has been the weakest among the major US stock indexes for several months now, particularly since the beginning of the summer when delta variant concerns threw into question the ‘re-opening trade.’
Having already lost its uptrend from the March and November 2020 lows, the Russell 2000 has been trading below both its daily 21-EMA and its daily 50-SMA, which have a bearish disposition. Daily MACD is trending lower below its signal line, while daily Slow Stochastics have turned lower through their median line and are quickly approaching oversold territory.
A deeper setback towards range lows in place since March 2021, closer to 2100, is not out of the question through the end of August.

US S&P 500 (ETF: SPY; CFD: SPX) TECHNICAL ANALYSIS: DAILY CHART (August 2020 to August 2021) (CHART 2)

The S&P 500 set fresh record highs earlier this week, and like the Dow Jones Industrial Average, it will be “a function of gravity playing its part on how it could climb.” But within the uptrend, there have been some technical signals that warrant consideration if a deeper pullback could develop.
Countertrend momentum is beginning to set in, with daily MACD turning lower (albeit above its signal line), while daily Slow Stochastics are nearing an exit from overbought territory. While the daily 21-EMA has been strong support since mid-July, pullbacks below the daily 21-EMA have seen quick drops back to the daily 50-SMA, which have been met with feverous buying interest over the past year; a loss of 4420 could produce a move towards 4345 before buyers attempt to retake control.

IG Client Sentiment Index: US S&P 500 Price Forecast (August 18, 2021) (Chart 3)
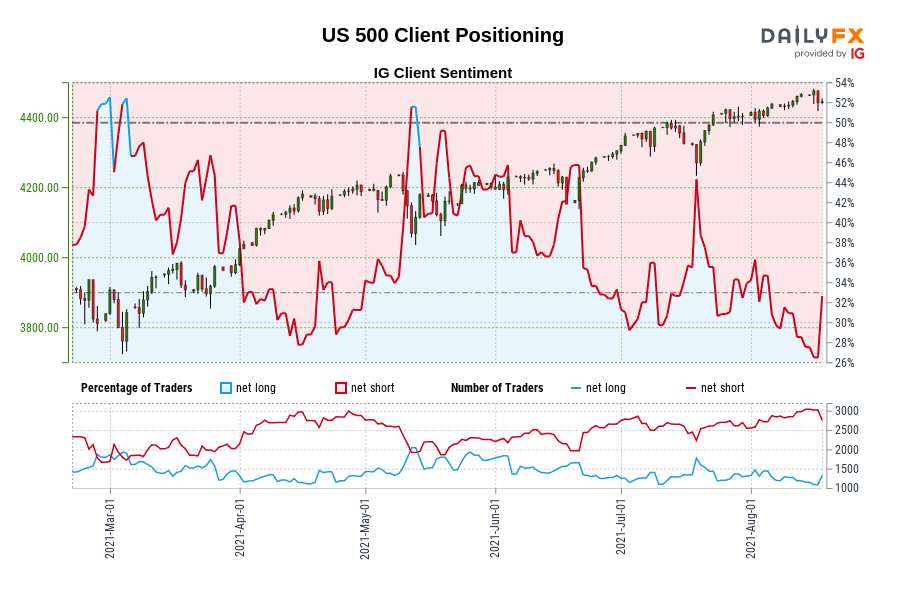
US 500: Retail trader data shows 32.55% of traders are net-long with the ratio of traders short to long at 2.07 to 1. The number of traders net-long is 12.53% higher than yesterday and 1.79% higher from last week, while the number of traders net-short is 3.41% lower than yesterday and 1.25% higher from last week.
We typically take a contrarian view to crowd sentiment, and the fact traders are net-short suggests US 500 prices may continue to rise.
Yet traders are less net-short than yesterday and compared with last week. Recent changes in sentiment warn that the current US 500 price trend may soon reverse lower despite the fact traders remain net-short.
--- Written by Christopher Vecchio, CFA, Senior Strategist


