


U.S. Indices Technical Highlights:
- Leading Nasdaq 100 stays inside the confines of bull channel
- S&P 500 broke down through bottom of the channel before recovering
- Trading bias continues to remain upward until pervasive price action sets in
So goes the NDX goes the SPX goes the world.
The Nasdaq 100 has been the leading index for some time, with it effectively run by the bull market leaders in FANMAG + TSLA. This seven stock group makes up nearly half the entire NDX’s weighting. And so by extension if the NDX it seems logical to label it as the most important stock market index there is in the U.S., and thus the world (US = 55% of global stock market cap).
With this backdrop in mind, looking at the daily chart the NDX is clearly in an uptrend at the moment, and a steady one at that. The impressive channel dating to late November remains well intact while the equivalent structures for the S&P 50 and Dow have been damaged. But again given the NDX’s importance, it’s technical posturing here keeps the broader market outlook higher.
At some point something has to give, and that will either be the top of the channel breaking, giving the Nasdaq 100 the opportunity to accelerate higher. Perhaps in a final hurrah as market sentiment is certainly frothy. Whether that will be the case or not, we will have to reserve judgement until later.
To turn the picture bearish, a break of the channel itself might not lead to a sell-off, but a break of the channel and a lower-low beneath the 12845 low will at least put the March trend-line to a test. A breaking of both the channel and March trend-line could be enough to set into motion a full-blown correction, or worse.
The bottom line is right now the channel and March trend-line are the important technical structures to watch here.

Nasdaq 100 Daily Chart (channel, March trend-line)
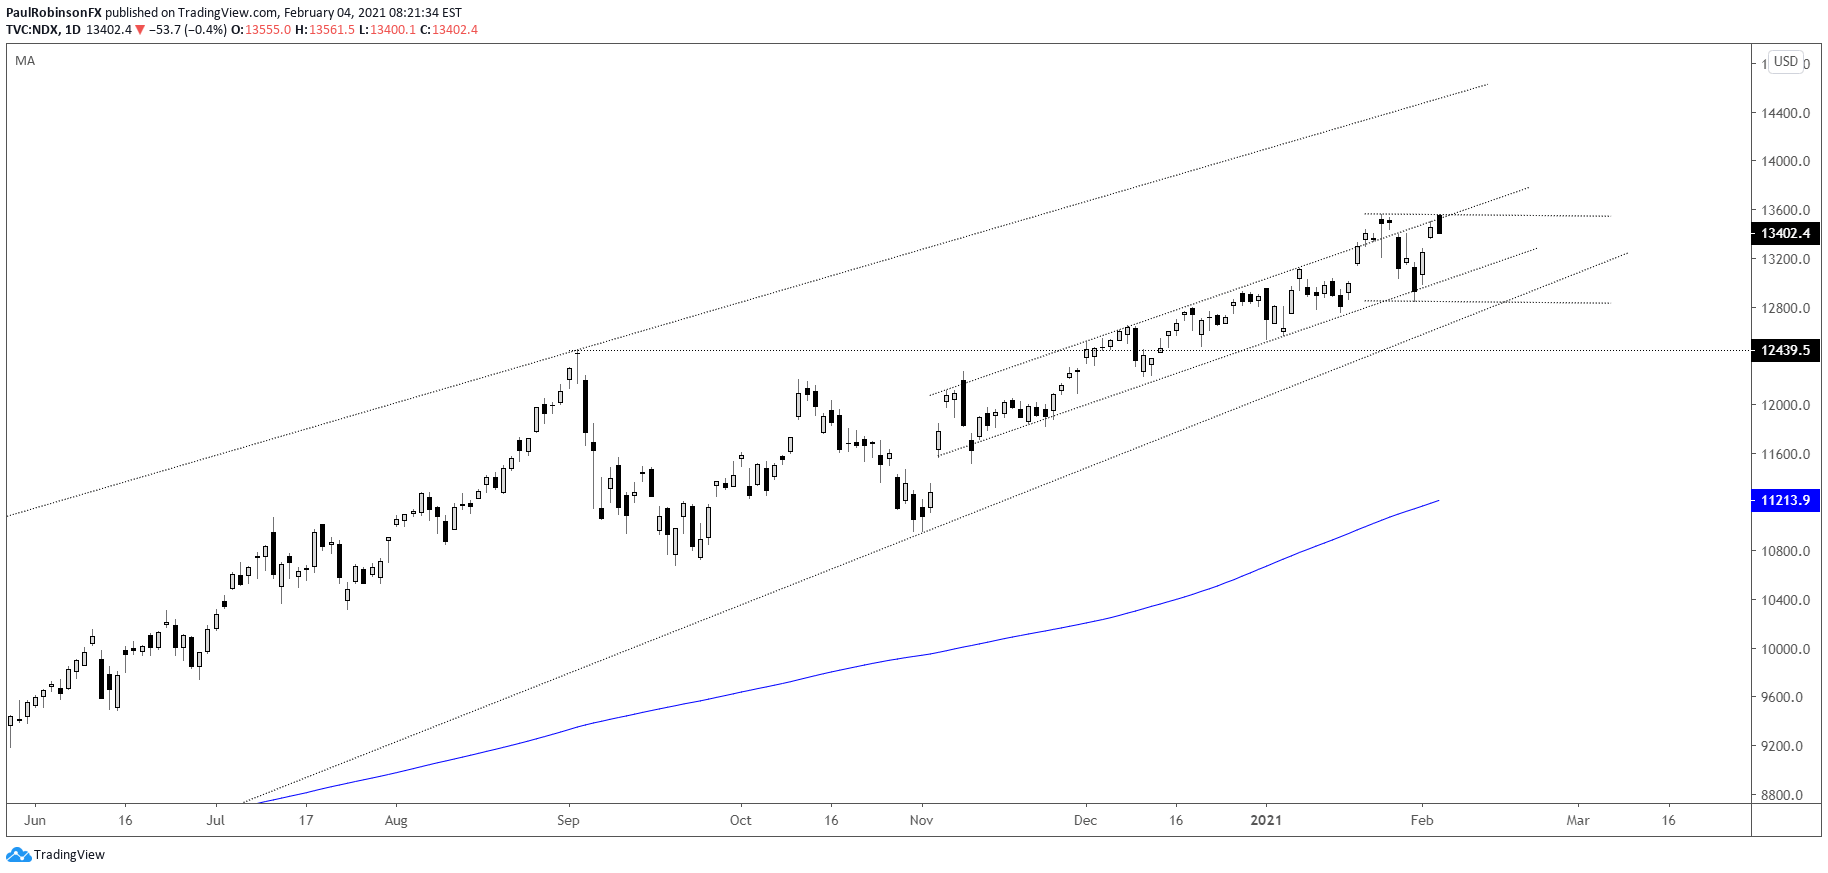
Nasdaq 100 Chart by TradingView
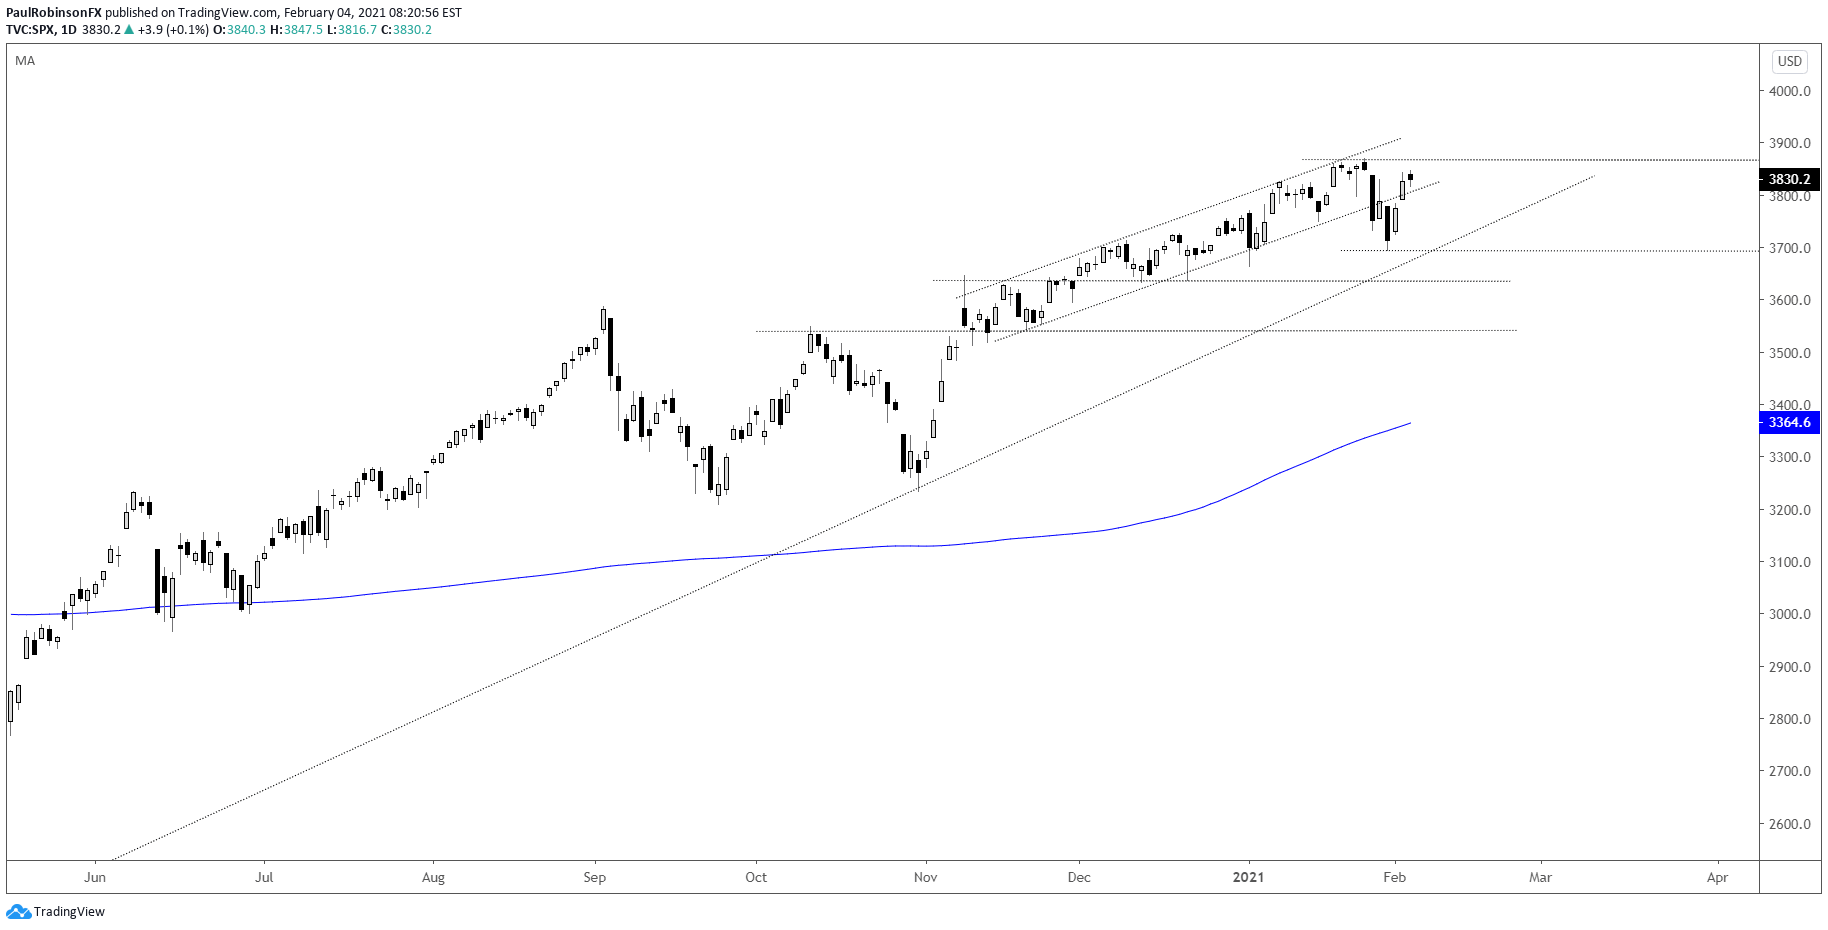
The S&P 500 broke the upward channel that the NDX maintained, but is currently back inside it. It came very near the March trend-line, which may have been what helped keep a floor in. Whether the near catch or not is the reason, we still know the NDX is the important index here and the March trend-line a very important technical threshold.
It will be important to watch how the S&P 500 acts should it cross above 3870, the prior record high. It will be up against the top of the breached channel, so an important test once breaking out of the structure. Again, though, the NDX here may be the more important index to watch for cues on S&P.
S&P 500 Daily Chart (March trend-line is big)
Resources for Forex Traders
Whether you are a new or experienced trader, we have several resources available to help you; indicator for tracking trader sentiment, quarterly trading forecasts, analytical and educational webinars held daily, trading guides to help you improve trading performance, and one specifically for those who are new to forex.
---Written by Paul Robinson, Market Analyst
You can follow Paul on Twitter at @PaulRobinsonFX


