


U.S. Indices Technical Highlights:
Dow Jones & S&P 500 continue to be bullish
The price action in indices continues to be bullish as new record highs get notched. With the action from November through December forming an upward sloping channel (bull-flag in the Dow), the market looks like it wants to run a bit here.
The Dow Jones is leading the way, as the tech-heavy Nasdaq is taking a bit of a backseat recently as the leader. That may change at some point as rotation swings back towards the bull market leaders (i.e. FB, AMZN, NFLX, MSFT, AAPL, GOOG), but for now the Dow is making good on a tightly formed bull-flag pattern.
This sets up the index to keep trading higher, but how much higher is difficult to say. There is a top-side trend-line from June in the current vicinity, but not seen as a major threat to the advance.
In the absence of pervasive downside price action, giving the benefit of the doubt to the long-side looks most prudent. On the flip-side, trying to find a top and short doesn’t hold any appeal. Traders may want to take a pullback approach to trading the rally should it become extended to avoid taking a hit on a dip.

Dow Jones Daily Chart (breaking out of bull-flag)

Dow Jones Chart by TradingView
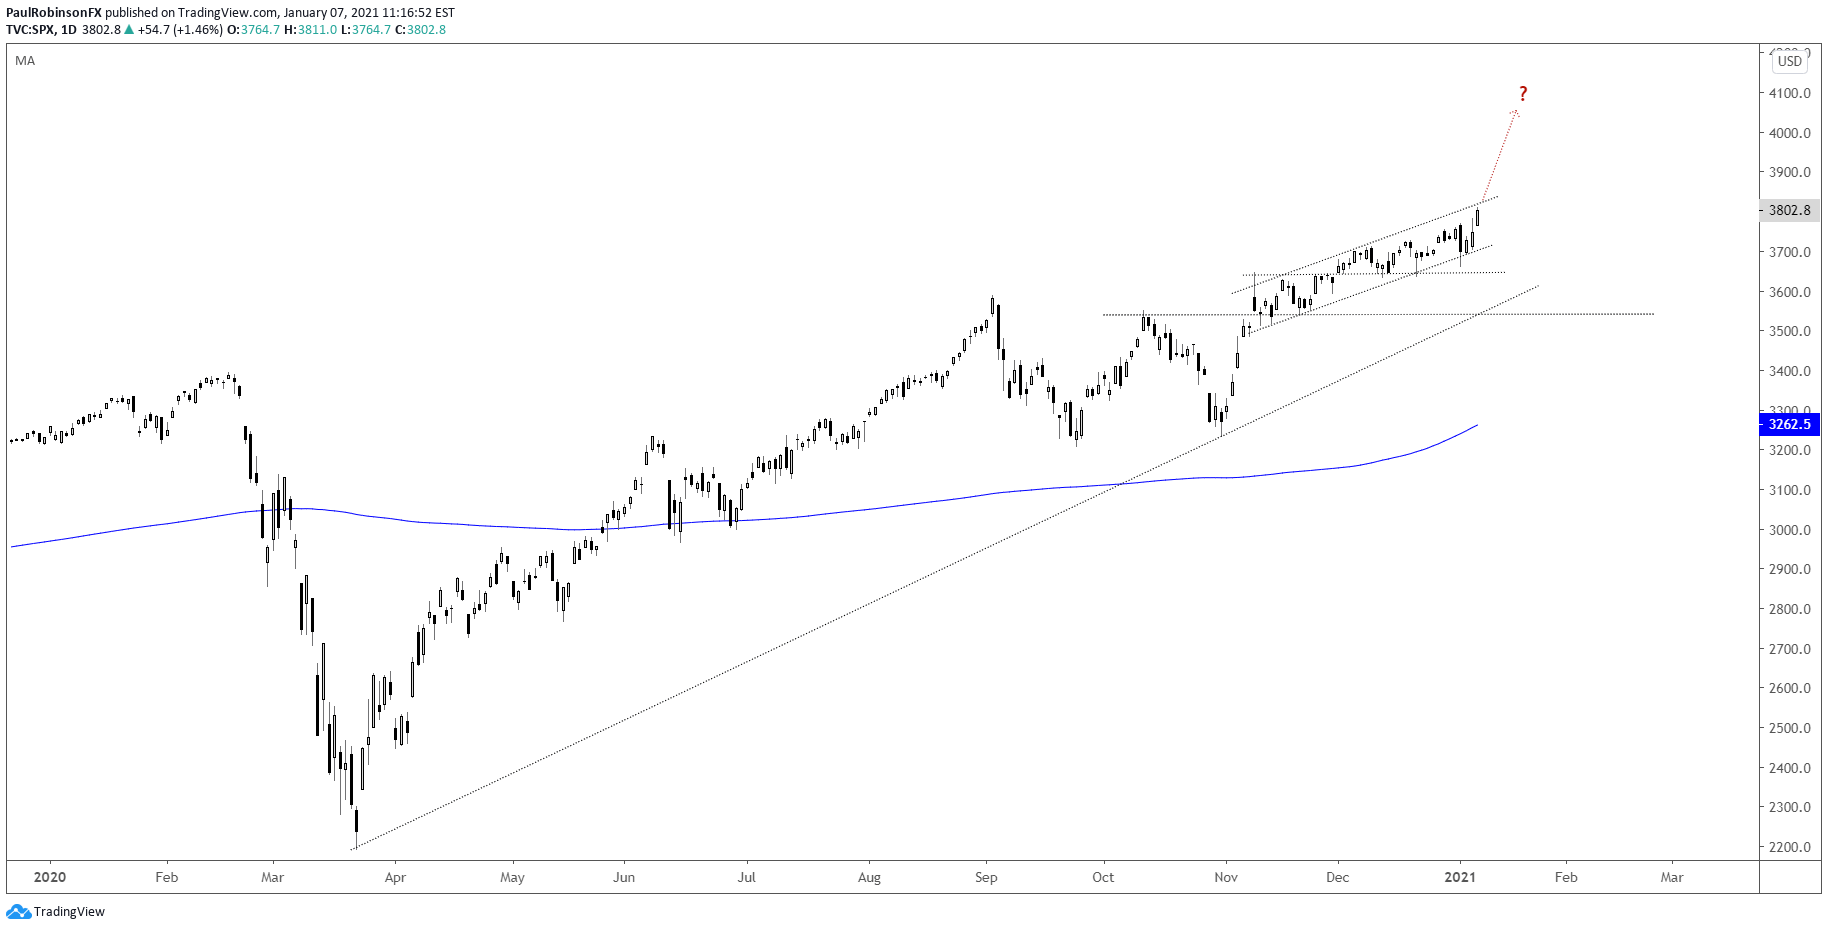
The S&P 500 is of course in similar position, but hasn’t quite escaped the confines of the upward sloping channel it has been trading in since early November. An acceleration out of the pattern looks to be in order, as general risk appetite continues to keep stocks motoring along.
The risk to the rally from a technical perspective, is if we were to see a sharp down-move take out the underside parallel of the channel. A break below 3662 may do the trick in undermining the move higher. But currently that looks like the lower probability outcome. Going with the trend until negative price action unfolds looks to be the best posturing at this time.
S&P 500 Daily Chart (looking to break out of channel)
Resources for Forex Traders
Whether you are a new or experienced trader, we have several resources available to help you; indicator for tracking trader sentiment, quarterly trading forecasts, analytical and educational webinars held daily, trading guides to help you improve trading performance, and one specifically for those who are new to forex.
---Written by Paul Robinson, Market Analyst
You can follow Paul on Twitter at @PaulRobinsonFX


