


U.S. Indices Highlights:
- S&P 500 positioned to keep working its way higher
- Dow Jones momentum sluggish but looks poised to break out
- Nasdaq 100 trend higher, FANMAG ready to break out
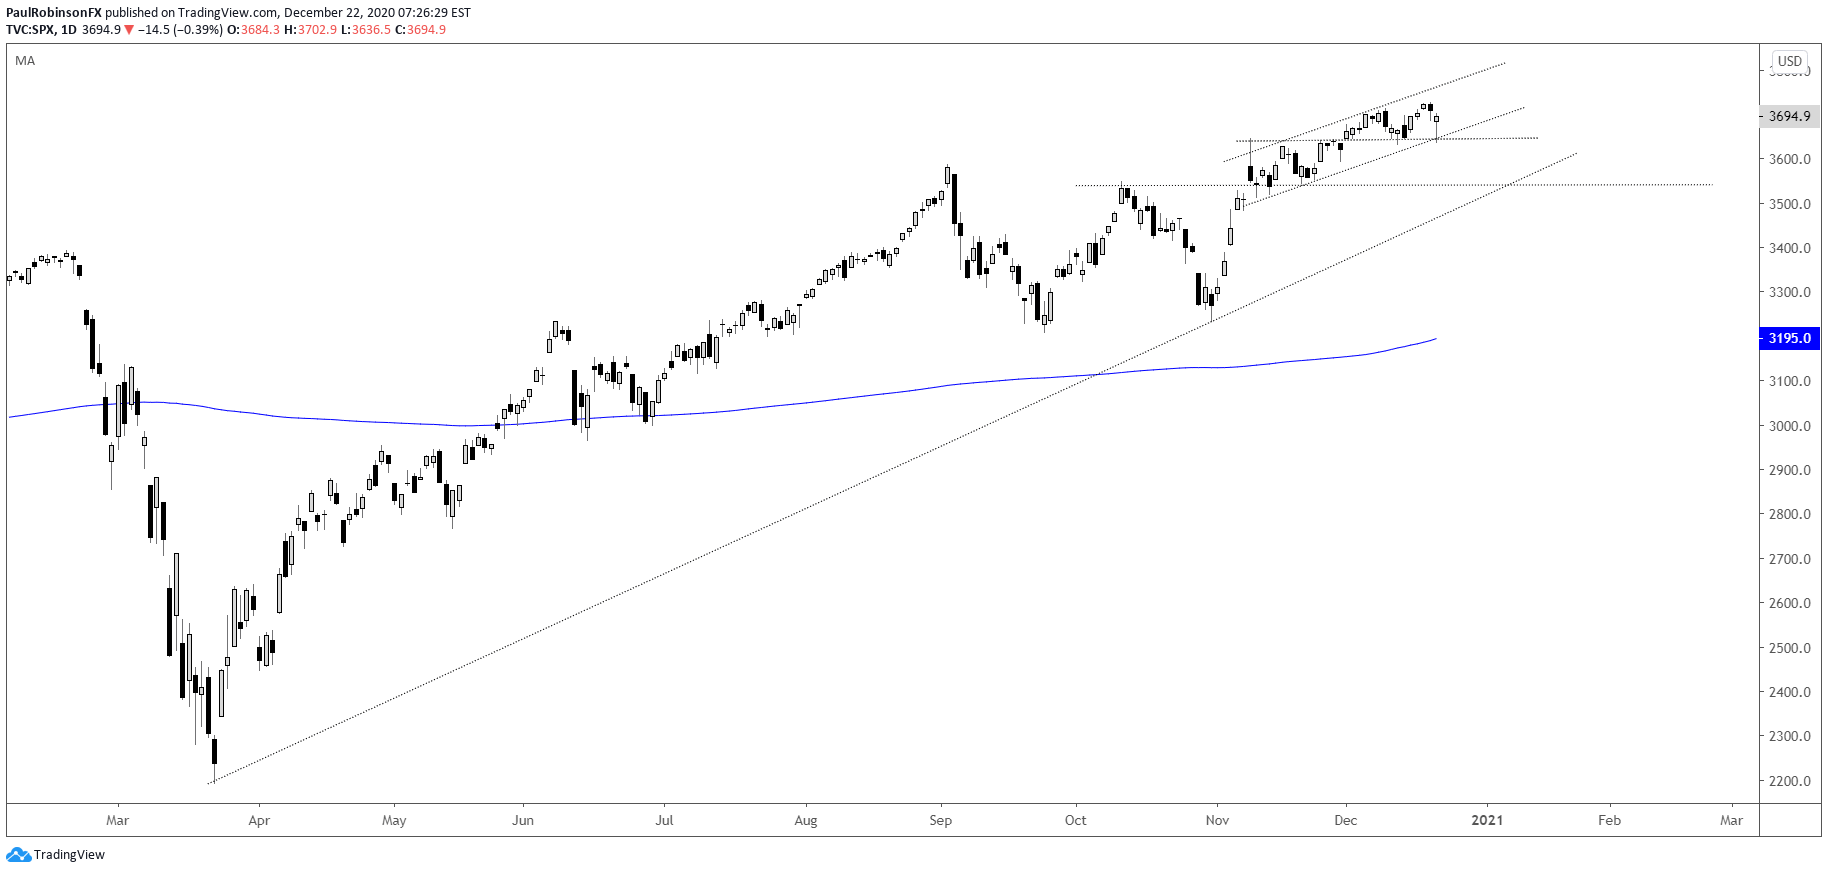
The S&P 500 took a hit yesterday on coronavirus fears, but most of its losses were wiped away quickly as was the case on other occasions when negative headlines hit the market regarding the virus. The trend remains firmly higher and with positive end of the year seasonality it appears likely stocks are headed higher.
There is support around the 3630/35 mark where yesterday’s low in the cash session formed. This was a reversal high from November and a smallish high and low that formed over the past month. The bottom-side of an upward channel also comes in around this support line.
It’s hard to say how high the market can go should it rally, but risk/reward at this time favors continuing to work from the long-side until we see clear signs that the market is reversing course. Perhaps we see a rally become extended into January that offers a reversal opportunity, but until such price action unfolds shorts hold little appeal.
S&P 500 Daily Chart (well supported)
The Dow Jones is grinding its way higher, and while it appears it losing momentum it could just as well be nearing a point where it launches higher out of what has amounted to a few weeks of consolidation. A break down below 29568 would be reason for caution, with risk turning towards the March trend-line. Otherwise, not seeing a good reason to turn negative on the Dow.
Dow Jones Daily Chart (could shoot higher soon)
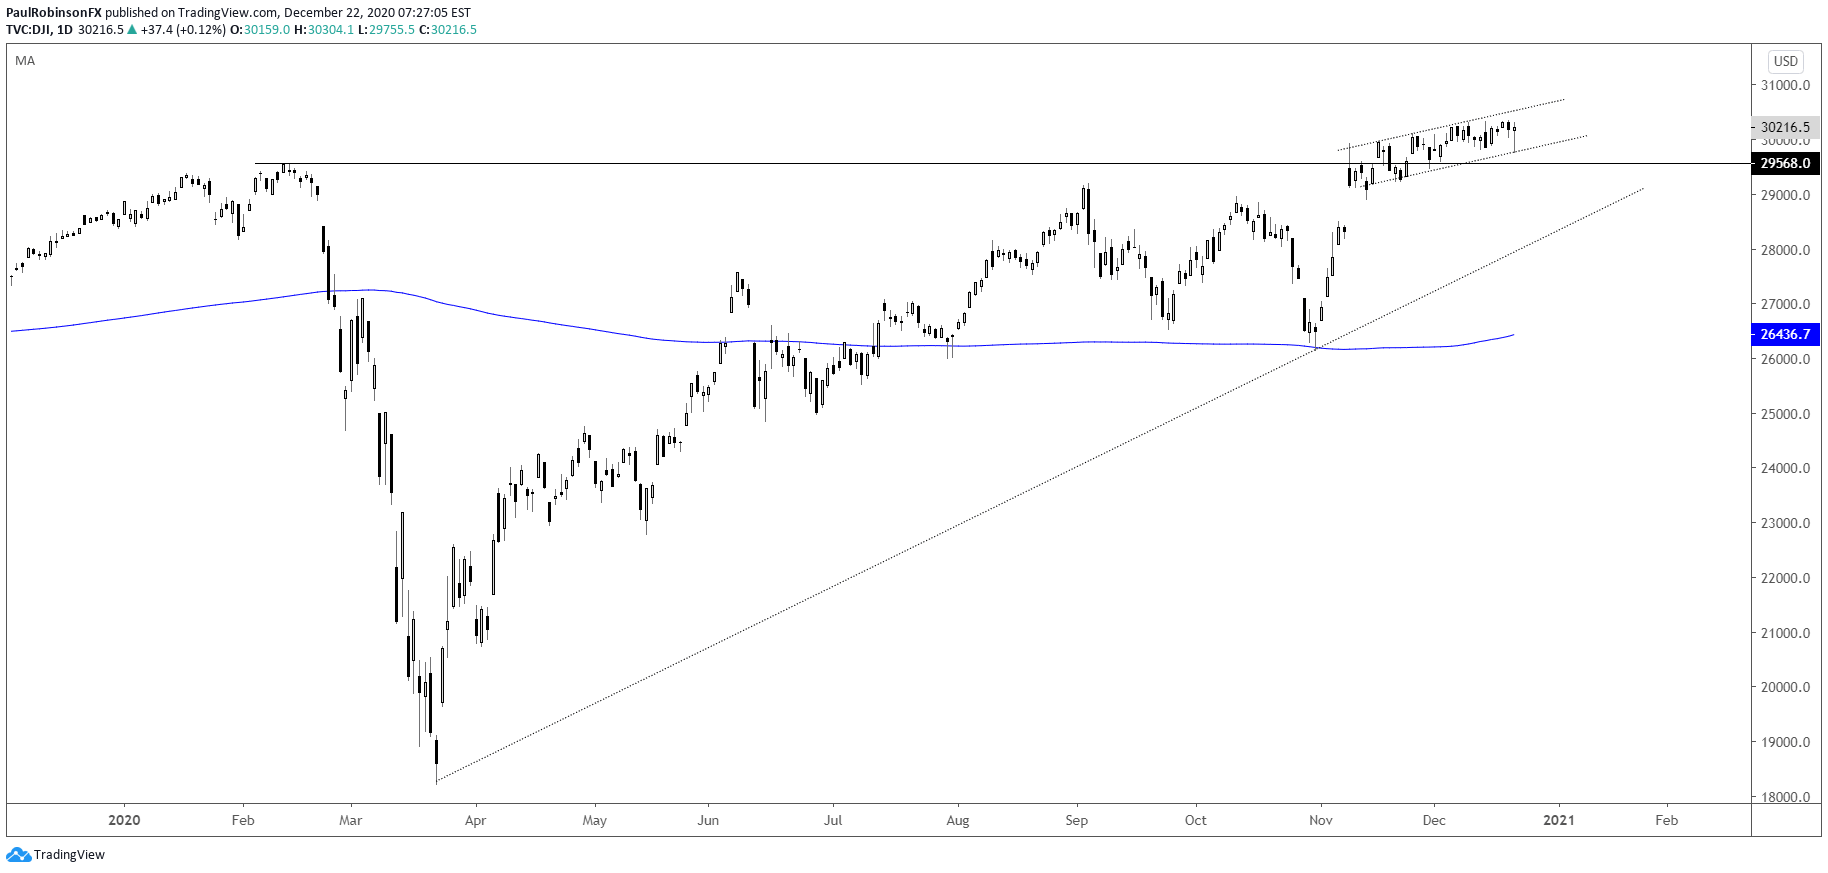
Dow Jones Chart by TradingView
The Nasdaq 100 is in position to rally strongly again if its leading group of stocks break out of the triangle formation they have been stuck in for quite some time now. FANMAG (FB, AAPL, NFLX, MSFT, AMZN, GOOG) has built a nice triangle pattern that is arriving at the apex in what could be a timely run-in with Santa.
A breakout here soon could drive the Nasdaq 100 considerably higher. Watch for a downside break-out, fake out then reversal higher (a common characteristic of tightly coiled triangles). A breakdown could also spell trouble, but at this time seen as the lower probability scenario.
Nasdaq 100 Daily Chart (could extend higher soon)
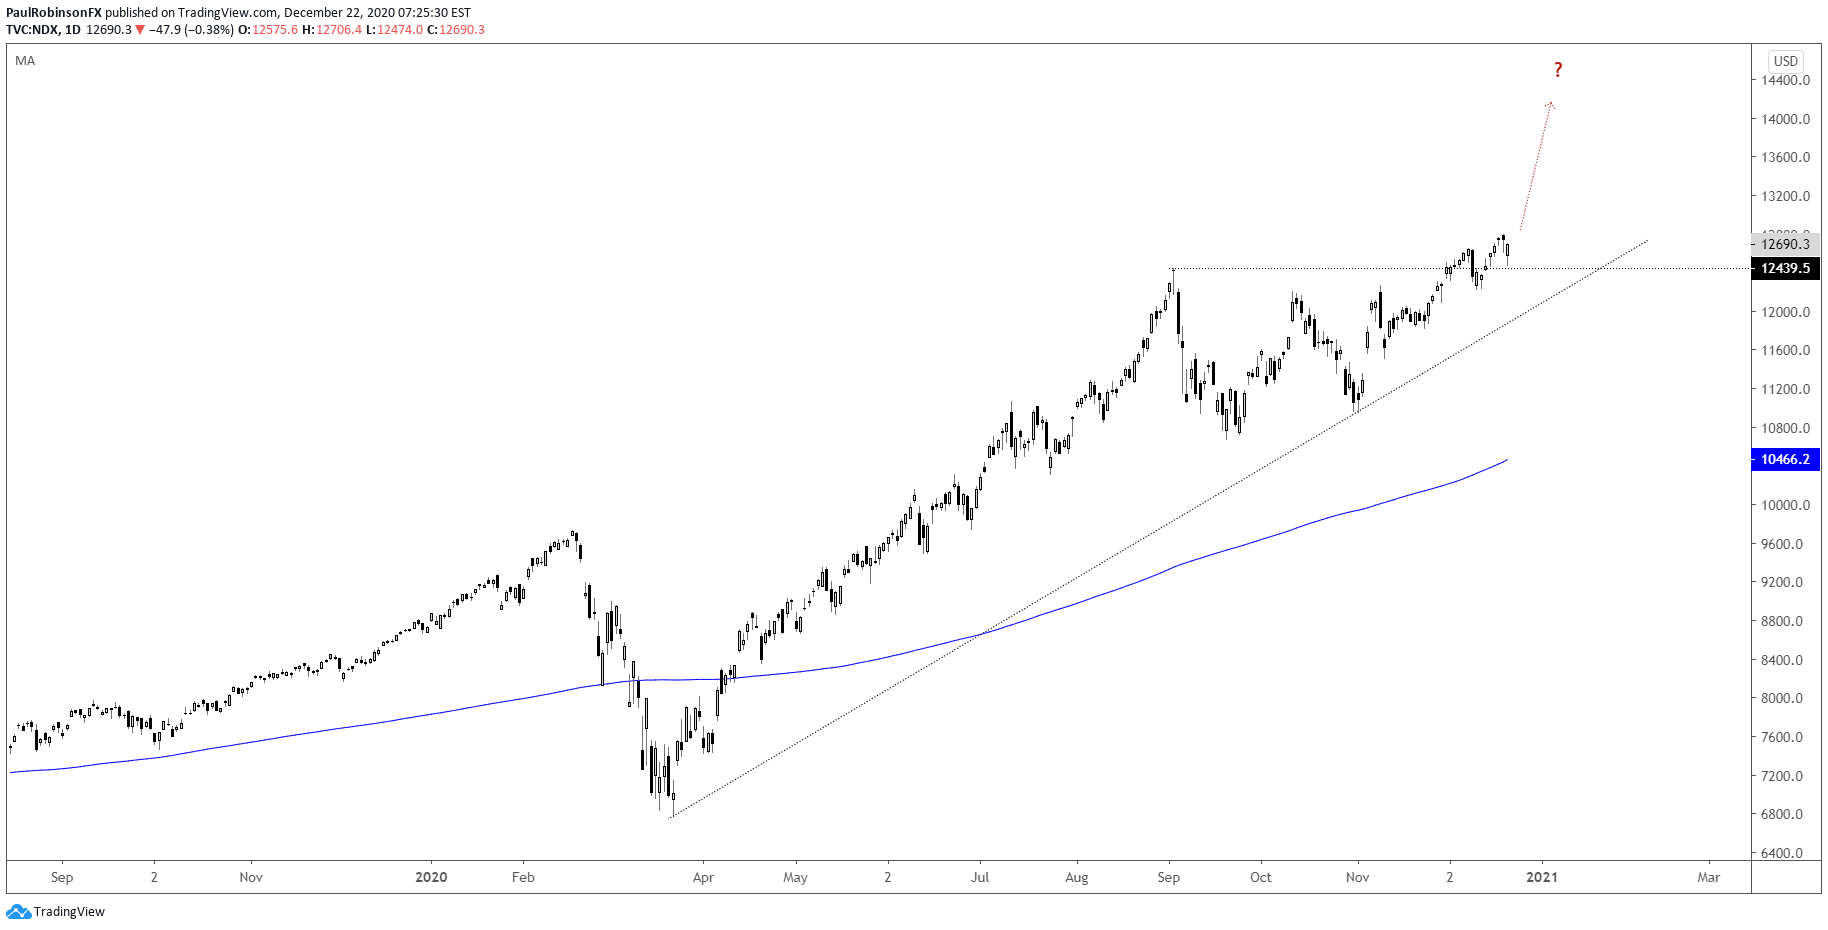
Nasdaq 100 Chart by TradingView
FANMAG Daily Chart (Triangle ready to break)

Resources for Forex Traders
Whether you are a new or experienced trader, we have several resources available to help you; indicator for tracking trader sentiment, quarterly trading forecasts, analytical and educational webinars held daily, trading guides to help you improve trading performance, and one specifically for those who are new to forex.
---Written by Paul Robinson, Market Analyst
You can follow Paul on Twitter at @PaulRobinsonFX


