


U.S. Indices Highlights:
- S&P 500 sitting near highs, trend remains difficult to fight
- Nasdaq 100 generally in a consolidation pattern
The S&P 500 is sitting in record territory after flying higher in the wake of the U.S. election and Pfizer coronavirus vaccine news. This is the third sharp rise to a high since early September, will the result be as it was the past two times?
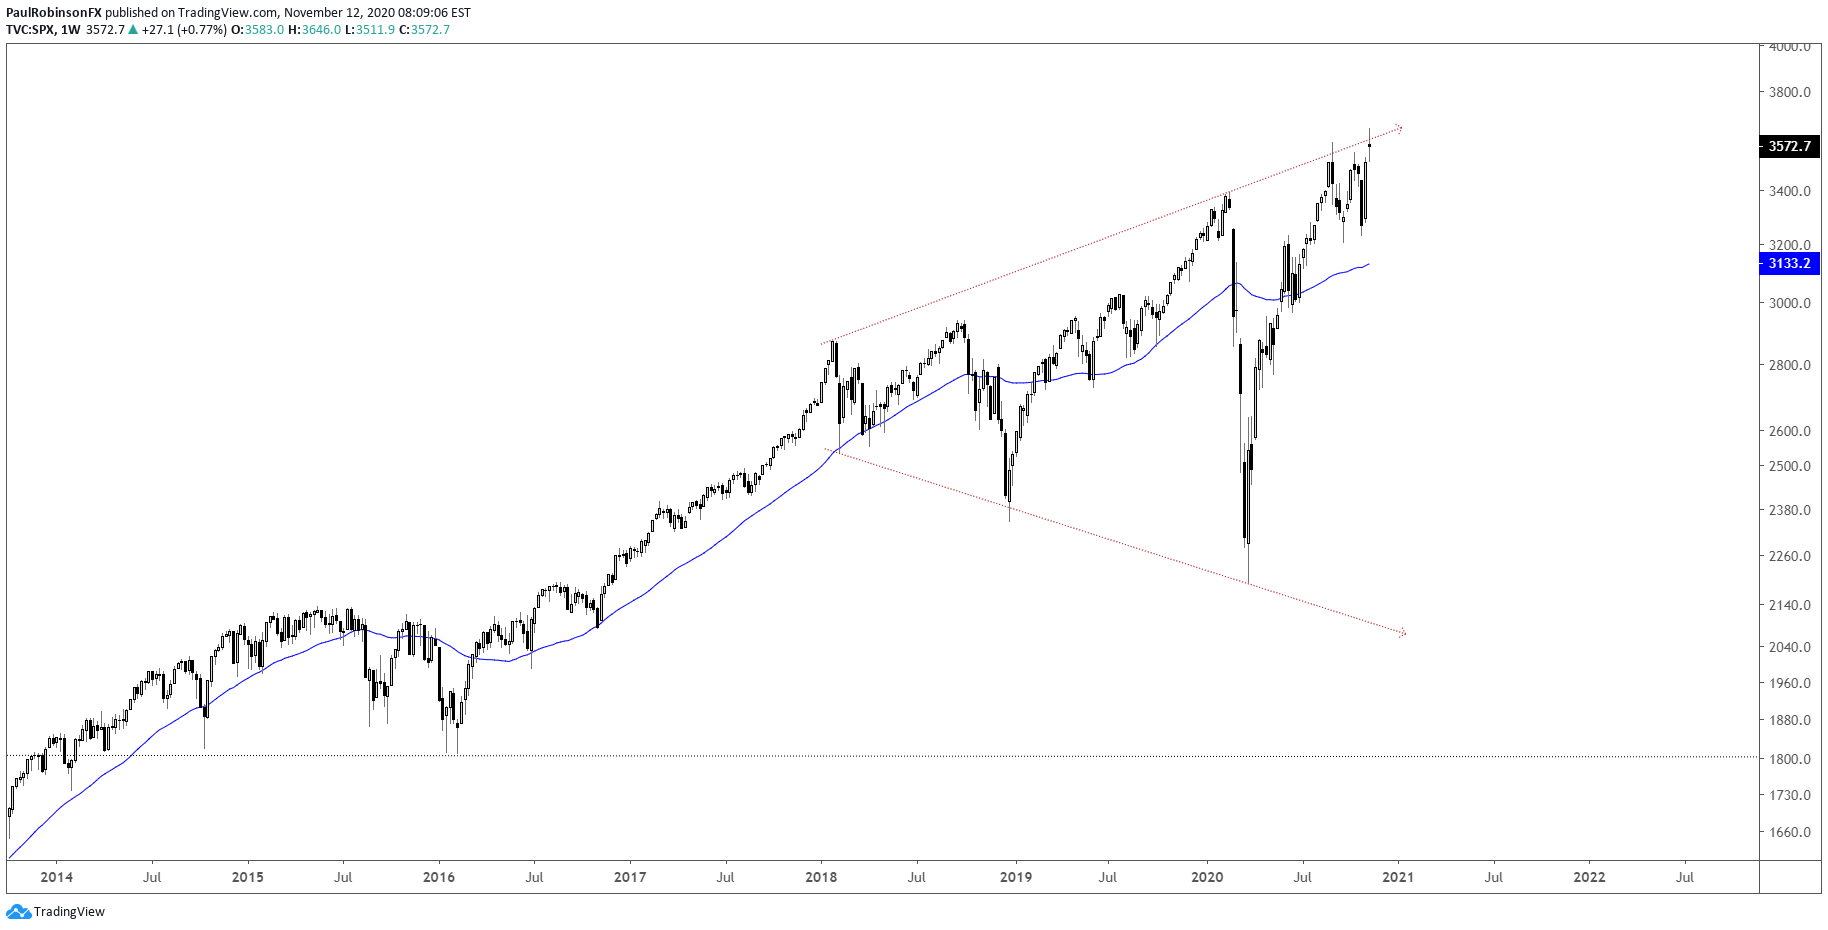
If that is the case then we should see the market turn lower right about now following the bearish reversal on Monday. How low we go is hard to say given the broader trend is higher. There is a top-side trend-line from 2018 that may be problematic to cross, but still overall the tone of the market appears firm.
A drop back towards the March trend-line keeps the S&P in range-building mode. This would appear likely to be a consolidation if it does, but a topping pattern can’t be ruled out. Too soon to say for now. Weakness in the very near-term appears likely, but we’ll see how that unfolds before drawing further conclusions.

S&P 500 Daily Chart (may weaken but still in range)

S&P 500 Weekly Chart (top-side line of broadening pattern)
Overall, the Nasdaq 100 is moving sideways with little direction cue other than the broader trend is still up. Until the sideways sequence is snapped with some meaningful weakness then the outlook will remain neutral to bullish. A broader consolidation pattern could develop further, but we will need to be patient. Crossing above 12439 gets the NDX back into record territory.
Nasdaq 100 Daily Chart (appears to be consolidating)

Nasdaq 100 Chart by TradingView
Resources for Forex Traders
Whether you are a new or experienced trader, we have several resources available to help you; indicator for tracking trader sentiment, quarterly trading forecasts, analytical and educational webinars held daily, trading guides to help you improve trading performance, and one specifically for those who are new to forex.
---Written by Paul Robinson, Market Analyst
You can follow Paul on Twitter at @PaulRobinsonFX


