


Nasdaq 100 Technical Highlights:
- Falling back towards a retest of the top of the bull market channel
- Whether it holds or not could hold major big-picture ramifications for global stocks
The recent breakdown in the stock market again has the bull market leading Nasdaq 100 on the cusp of testing an important long-term threshold. It is perhaps one of the most important technical signposts in any market. The NDX represents the market leaders (FANMAG+T) that the overall US market relies on, and by extension global markets also rely on. Furthermore, the NDX has undergone a particular price sequence that represents a potentially massive make or break situation.
For some time, we have been discussing the relevance of the channel observed on the weekly/monthly time-frame when looking at an NDXlog chart. It has acted as a reliable guide the past nearly three years with three peaks and two troughs occurring on the upper and lower parallels.
In July, though, the NDX left the confines of the pattern, which effectively put it into no man’s land. When the neat confines of the bull channel were left behind it opened the door for a strong, if not parabolic, move as often these patterns do regardless of the time-frame. It still could go vertical as long the index can stay on the outside of the formation.
But it needs to hold the top line.
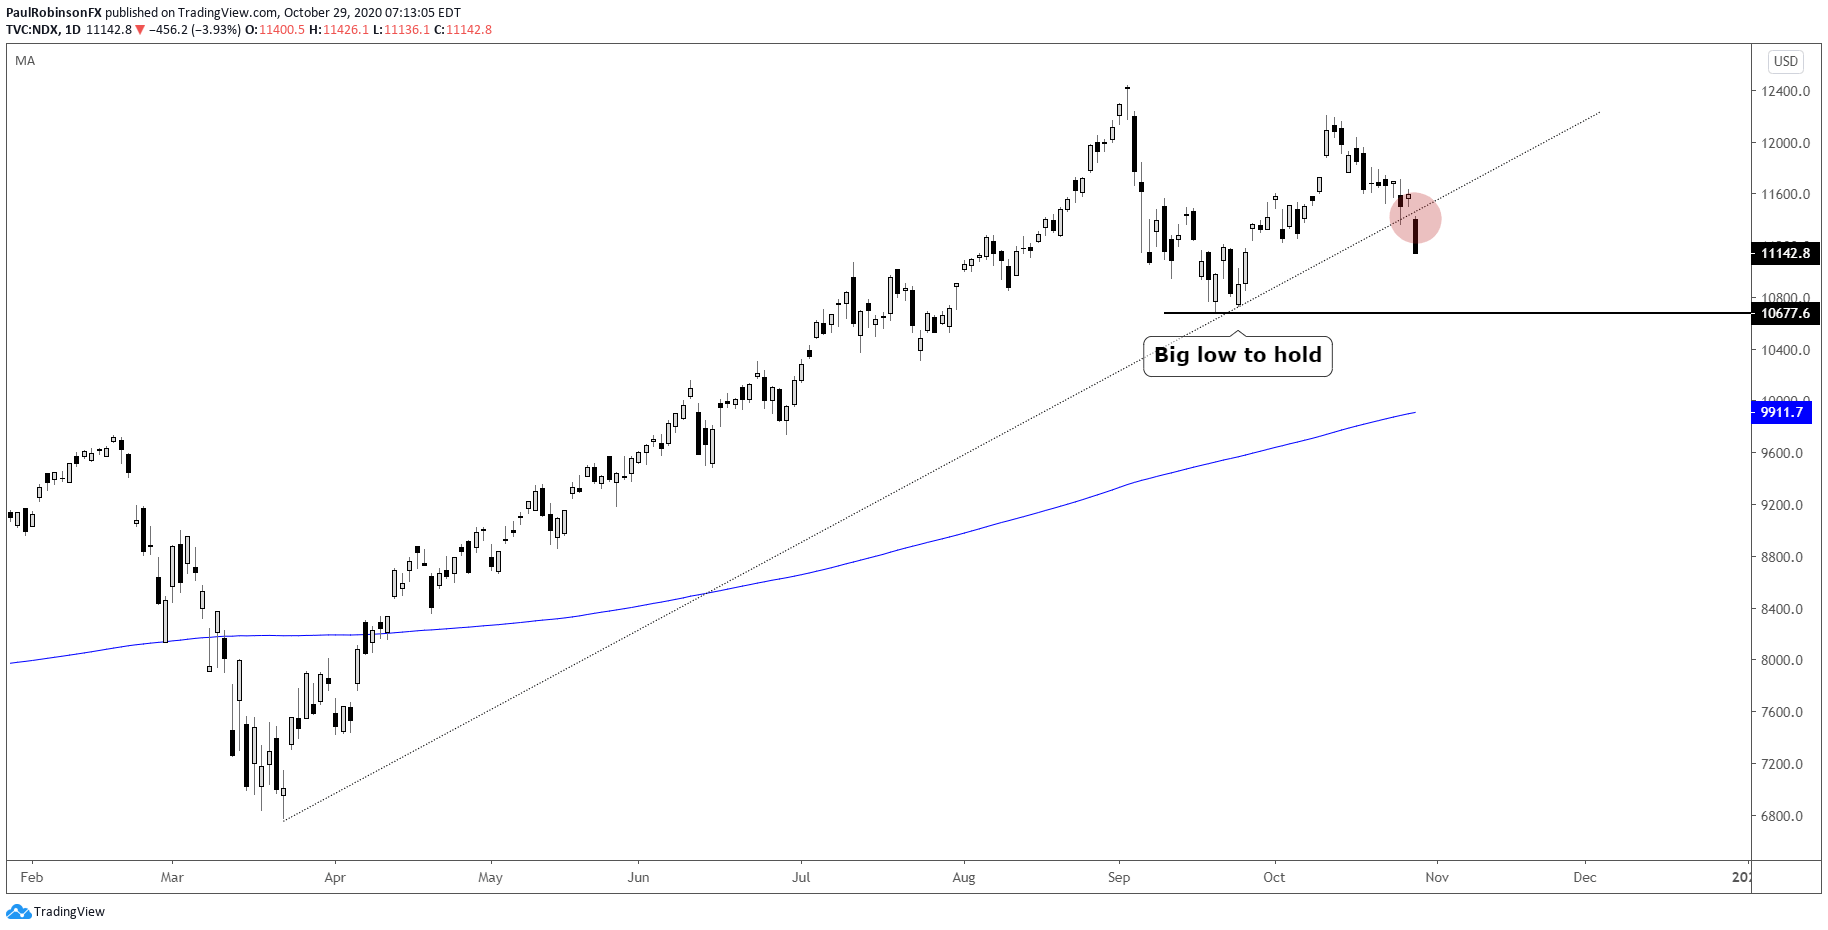
The top of the channel was tested in September and held well; will the next test hold the same fate? It appears we may find out very soon. If it does hold, then the market lives to fight another day or better. If the NDX doesn’t and drops below the September low at 10677 on a weekly closing basis, then we will have the NDX failing to maintain its upward thrust out of the pattern, and it will be considered an exhaustion sequence that leads to a strong change of trend instead of the beginnings of what may have amounted to a ‘blow-off’ stage in the extended bull market.
The bottom line is this – stay above the upper parallel and September low and the outlook is neutral to bullish. Fall back inside the channel and the outlook will quickly turn towards potentially seeing the Nasdaq 100 trade down to the lower parallel of the bull market channel. That level lies somewhere in the 8000s at this juncture, indeed a hefty decline it would be.

Nasdaq 100 Weekly Chart (Top of channel test nearing)

Nasdaq 100 Daily Chart (broken trend-line, sept low looks next)
Nasdaq 100 Charts by Tradingview
Tools for Forex Traders
Whether you are a beginning or experienced trader, DailyFX has several resources available to help you; indicator for tracking trader sentiment, quarterly trading forecasts, analytical and educational webinars held daily, trading guides to help you improve trading performance, and one specifically for those who are new to forex.
---Written by Paul Robinson, Market Analyst
You can follow Paul on Twitter at @PaulRobinsonFX


