


U.S. Indices Highlights:
- Nasdaq 100 touches off on steadfast line of support
- A break would likely lead to another leg lower
- S&P 500 to follow suit, of course – correction on the horizon
The Nasdaq 100 sold off hard last week as speculative fervor hit a zenith, at least temporarily. The fierceness of selling took the index down by about 10% in less than two days to a very important line of support we have been using as a guide since the early part of summer.
The trend-line dates back to April and with Friday’s sudden reversal it now has seven inflection points, making it a reliable angle of support for managing a trading bias. At the moment it is holding, but a break would likely mark another round of selling.
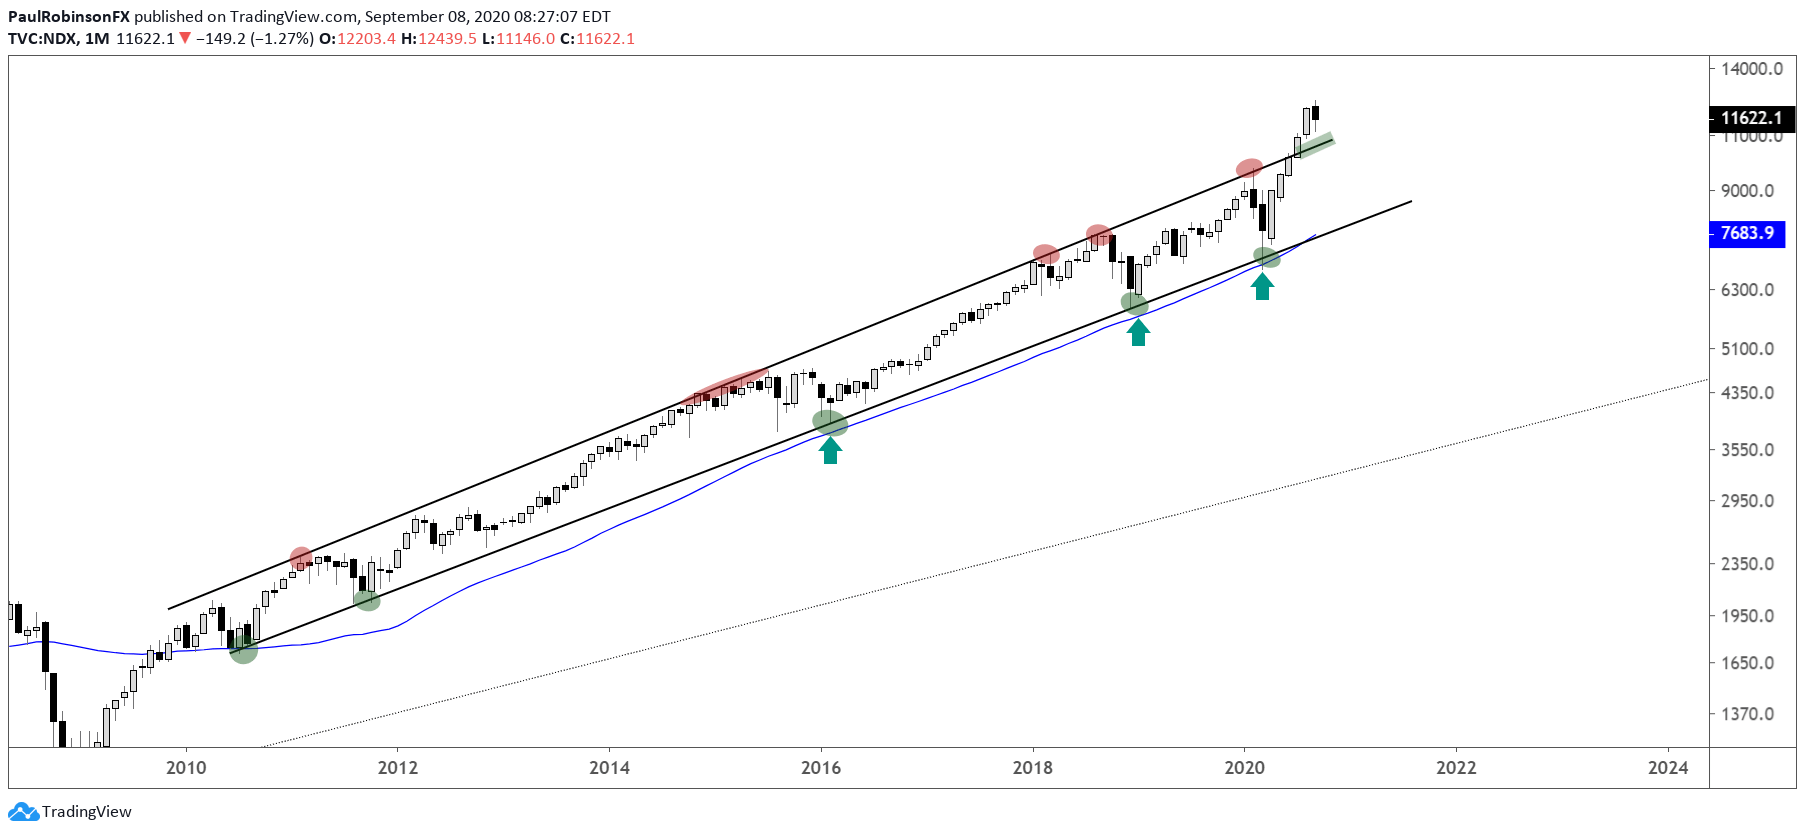
A break of Friday’s low at 11142 will have the NDX solidly below the trend-line and running lower towards the top of the long-term bull market channel the tech-heavy index broke above back in June. This is around roughly 10600.
A test of the top of that channel is viewed as being quite significant because when a channel is broken in the direction of the trend (especially this one dating back to post-GFC) it can mark an important event – either the market accelerates higher and keeps on going into a major blow-off phase, or it rises above the channel by a relatively small amount and then falls back inside the channel, which is seen as an ‘overthrow’ event marking a larger top.
We don’t need to predict how this will play out, though. If the NDX drops back to the top of the channel as a retest, as long as it holds as support, then longs remain in control and the market can continue to rise. If, however, a decline finds the NDX falling back inside the channel, then the likelihood increases that we have seen a much larger top form and shorts will gain the upper hand.

Nasdaq 100 Daily Chart (trend-line an important guide)

Nasdaq 100 Monthly Chart (Watch top of channel on more weakness)
Nasdaq 100 Charts by TradingView
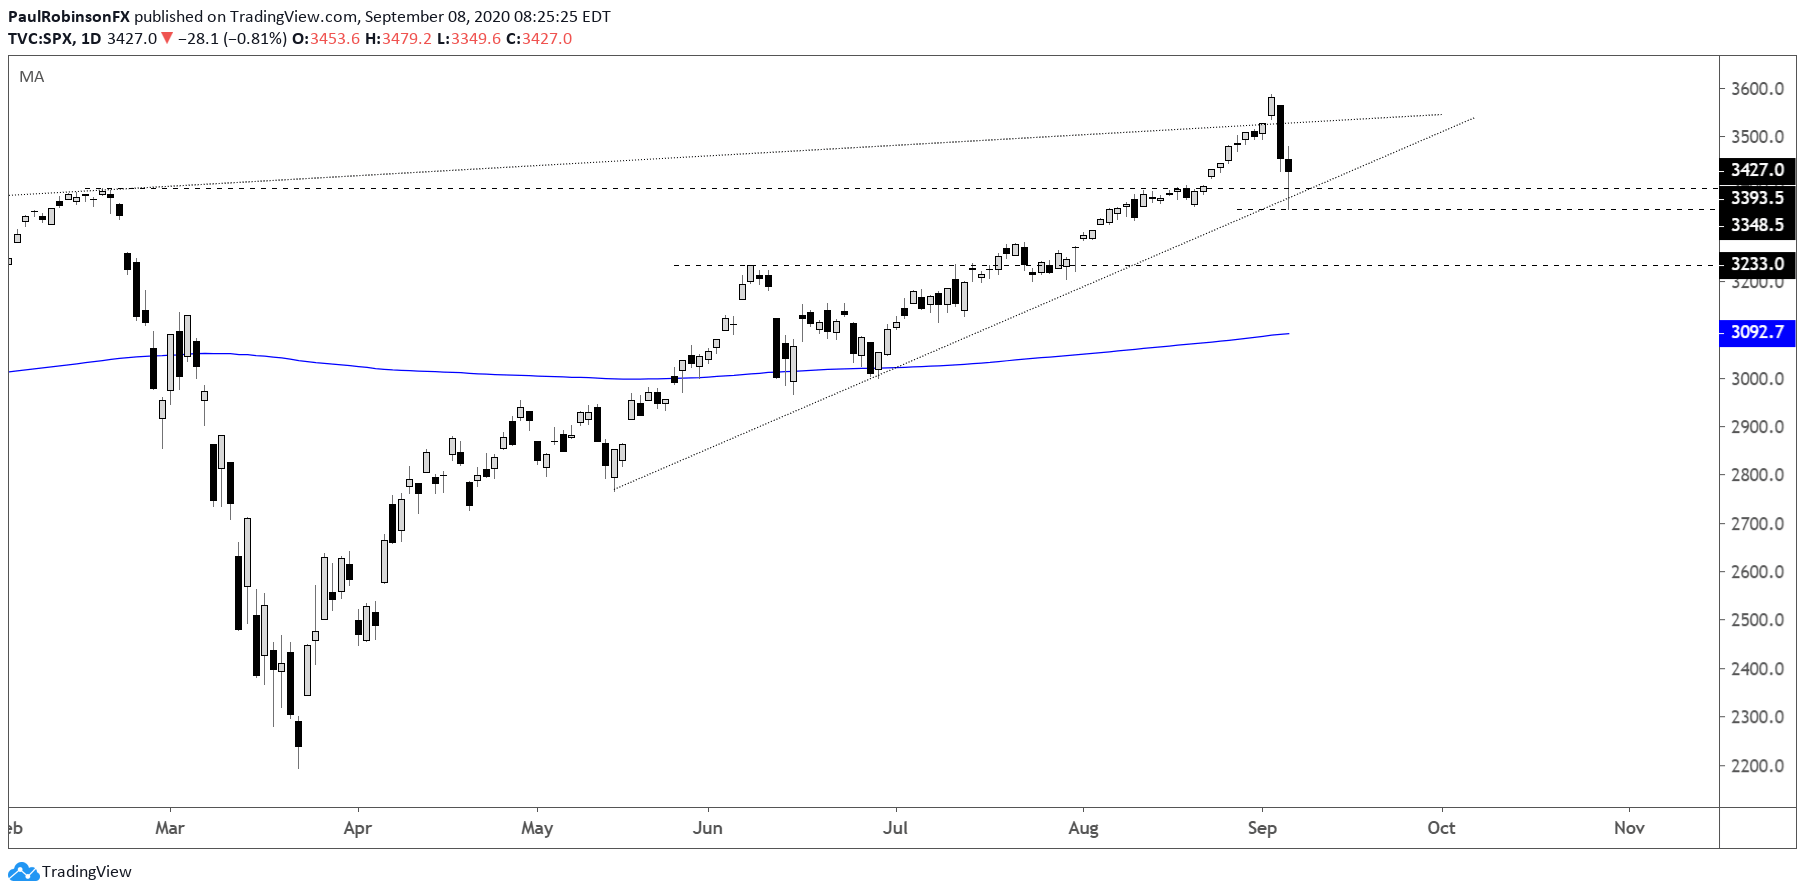
The S&P 500 dipped below the February high on Friday, but was able to recover back above with a reversal candle. If the low of that candle is broken at 3349, it will not only constitute a drop below the old high but also a trend-line from May. In the event this happens it is likely the aforementioned trend-line in the NDX has also broken. If that is the case, the we could see an extended slide down to the June high at 3233 as the next level of support.
If the SPX and NDX can both hold support, then perhaps last week’s decline, while fierce, is over and the market can begin to trade higher. Right now, the bearish scenario looks alive and well given how extended market became, but support does need to break first for it to gain traction.
.
S&P 500 Daily Chart (trading around critical area)
Resources for Forex Traders
Whether you are a new or experienced trader, we have several resources available to help you; indicator for tracking trader sentiment, quarterly trading forecasts, analytical and educational webinars held daily, trading guides to help you improve trading performance, and one specifically for those who are new to forex.
---Written by Paul Robinson, Market Analyst
You can follow Paul on Twitter at @PaulRobinsonFX


