


S&P 500 Index Price Outlook: Trader Positioning & Market Sentiment Ahead of the Fed
- S&P 500 looks vulnerable judging by recent changes in sentiment and market positioning
- Equity options traders scale back call buying activity as retail CFD traders unwind shorts
- FOMC policy update is due Wednesday, July 29 at 18:00 GMT and may spark volatility
The Federal Reserve’s Federal Open Market Committee (FOMC) is set to deliver an interest rate decision later today. As one might expect, there is potential for an uptick in volatility for key assets like Gold, the Dow and US Dollar around Fed announcements due to the material impact that changes in monetary policy can have across the market.

Even though no major policy shifts are expected out of this Fed meeting, investors will likely hone into policy statement and Chair Powell’s press conference nevertheless, as market participants aim to gauge the central bank’s latest leaning and outlook for the broader economy. Yet, has been no lack of excitement across markets over recent weeks, particularly, in the S&P 500 Index, and its impressive rise since its March low.
S&P 500 Index (Daily Chart)
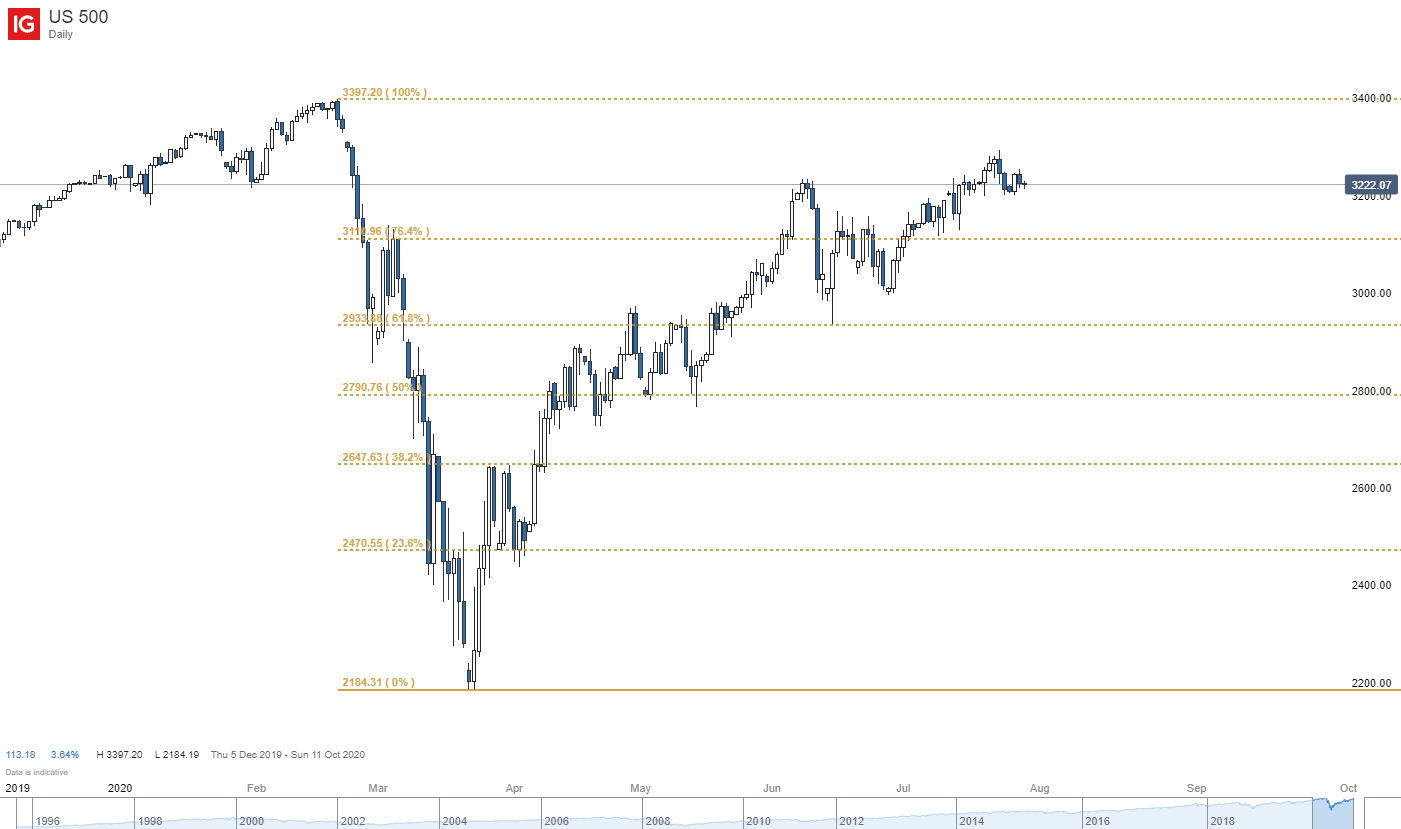
Source: IG Charts
The remarkable rally by stocks has started to lose momentum, however, as equity bulls flash signs of exhaustion. And while S&P 500 price action seems notably disconnected from the broad macroeconomic backdrop – considering the millions of Americans unemployed and 2Q US GDP growth due for a historic collapse – stock market enthusiasm has been fueled largely by aggressive monetary policy and fiscal stimulus efforts. That said, as liquidity and hope drives the bid, traders will likely tune in closely to upcoming remarks from the Fed.

S&P 500 vs CBOE SPX Equity Put/Call Ratio – 5-Day Average (Daily Time Frame)
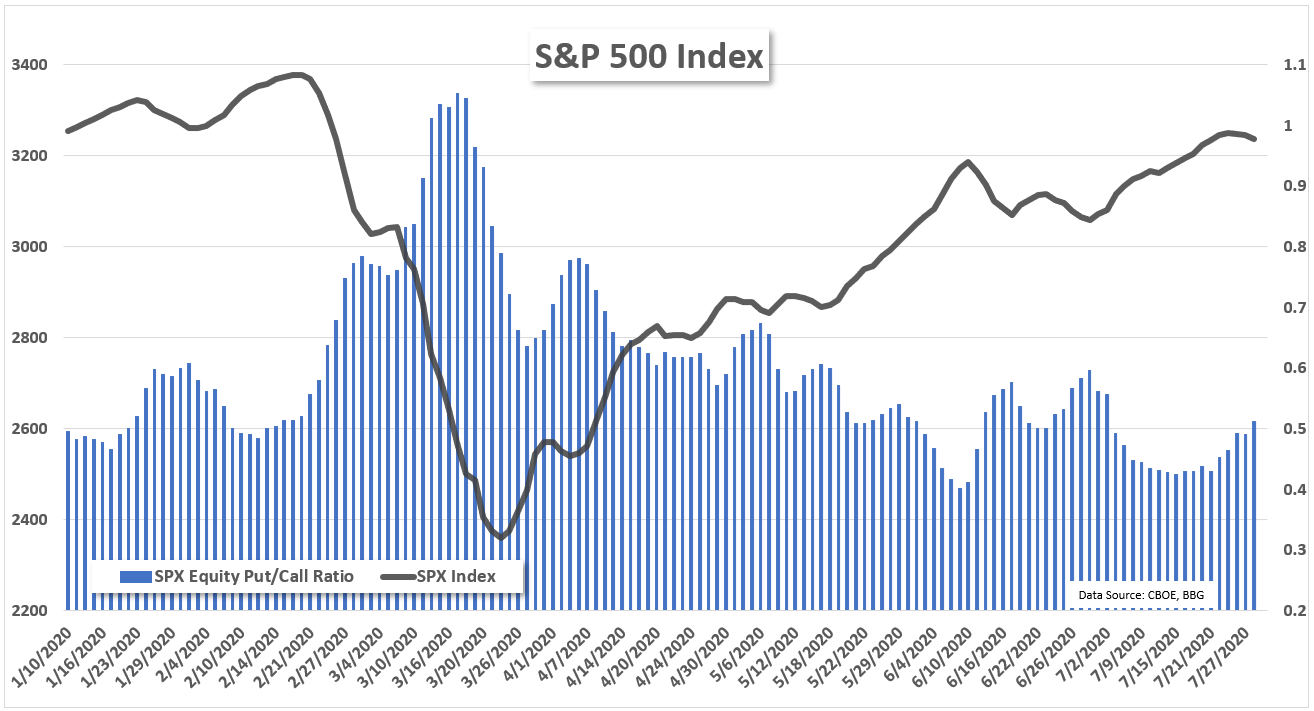
Looking to trader positioning with the Federal Reserve announcement on deck, equity options traders have turned less bullish on the S&P 500 Index judging by a rise in the Cboe equity put-call ratio, which reflects the number of outstanding put options over the number of outstanding call options. A rising ratio and a reading above 1.0 indicates bearish market positioning on balance whereas a declining ratio and a reading below 1.0 indicates bullish market positioning.
The current reading of 0.50 reveals that the market is positioned with roughly twice as many call buyers versus those holding puts, but the trend of the Cboe equity put-call ratio has turned higher over recent trading sessions as demand for downside protection, or demand put options, starts to increase while stocks struggle to keep advancing.
S&P 500 Index vs IG Client Sentiment (Daily Chart)
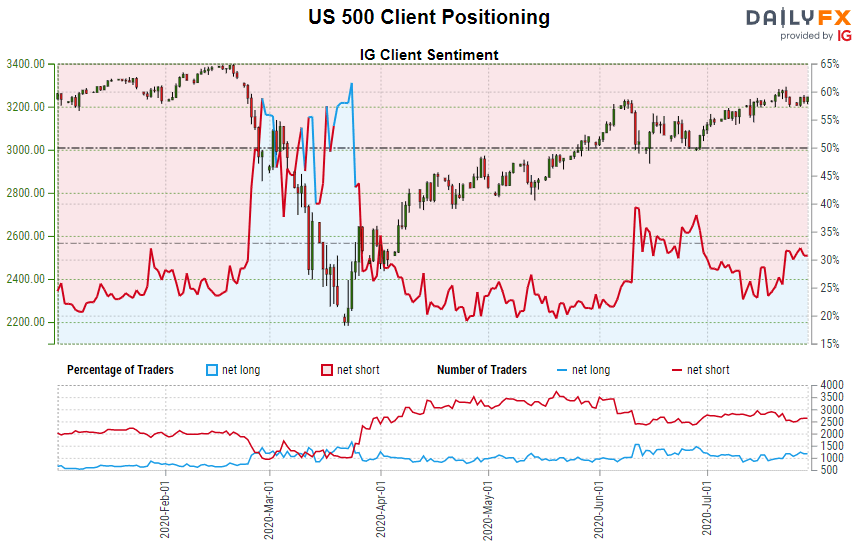
In comparison, we can shift focus to retail CFD trader positioning, which typically sends a contrarian signal, and find that IG Client Sentiment data similarly indicates potential for the S&P 500 Index to pivot lower. According to the latest IGCS report, 31.2% of retail CFD traders are net-long the S&P 500. That said, this percentage has climbed over recent trading sessions as market positioning turns relatively less bearish.

Specifically, the number of traders net-long has jumped 10.4% compared to last week’s reading and the number of traders net-short has dropped 2.1% over the same period. Recent changes in S&P 500 sentiment suggests that the current price trend may soon reverse lower despite the fact that retail CFD traders remain net-short on balance.


