


U.S. Indices Highlights:
- S&P 500 in corona-gap, fill with new highs could come soon
- Dow Jones still has some work to do to get to the gap
- Nasdaq 100 keeps on creating new records, sustainable?
The S&P 500 started the week by breaking out above the June high, and is currently in the massive gap-down from February 24 that kicked off the coronavirus meltdown in Q1. To fill the gap the S&P will need to rally up to 3337, where from there it will be just shy of the record high at 3393.
It could come quickly or it could come slowly or not at all, but as long as the trend structure in the near-term remains positive then so does the trading bias. At this juncture it would require a sharp downdraft followed by the inability to recover before considering flipping the script.
Thus far declines of forceful nature have been very short-lived, measured in days at most and in a couple of instances lasting only a single day (June 11, for instance). Which is why it will take some turning of the tide to get the edge in favor of shorts as a general trading bias.
That tune may change as the summer progresses, when seasonality may align with a vulnerable market that will have plenty of reasons to sell off (coronavirus, China-US tensions, US elections, etc.)…

S&P 500 Daily Chart (in corona-gap)

The Dow Jones is lagging behind as it isn’t home to all the big market darlings (FANMAG + Tesla), and so it suffers to rally with as much force as the S&P 500, and especially the Nasdaq 100 which is run by only a handful of stocks. The Dow has yet to overcome the June high at 27580, so that is first up as resistance, then the corona-gap in the 28Ks can be tackled.
There is some nice trend-line support rising up from a swing-low in April that has several inflection points. This will be first up along with the 200-day as an area of support on weakness. The area around the 200-day held good as resistance, so it anticipated to hold as support for now (~26200/300). But keep in mind if the market does start to roll over, given the relative weakness to other indices, the Dow could be a leader on the downside.
Dow Jones Daily Chart (>200-day, June high next)
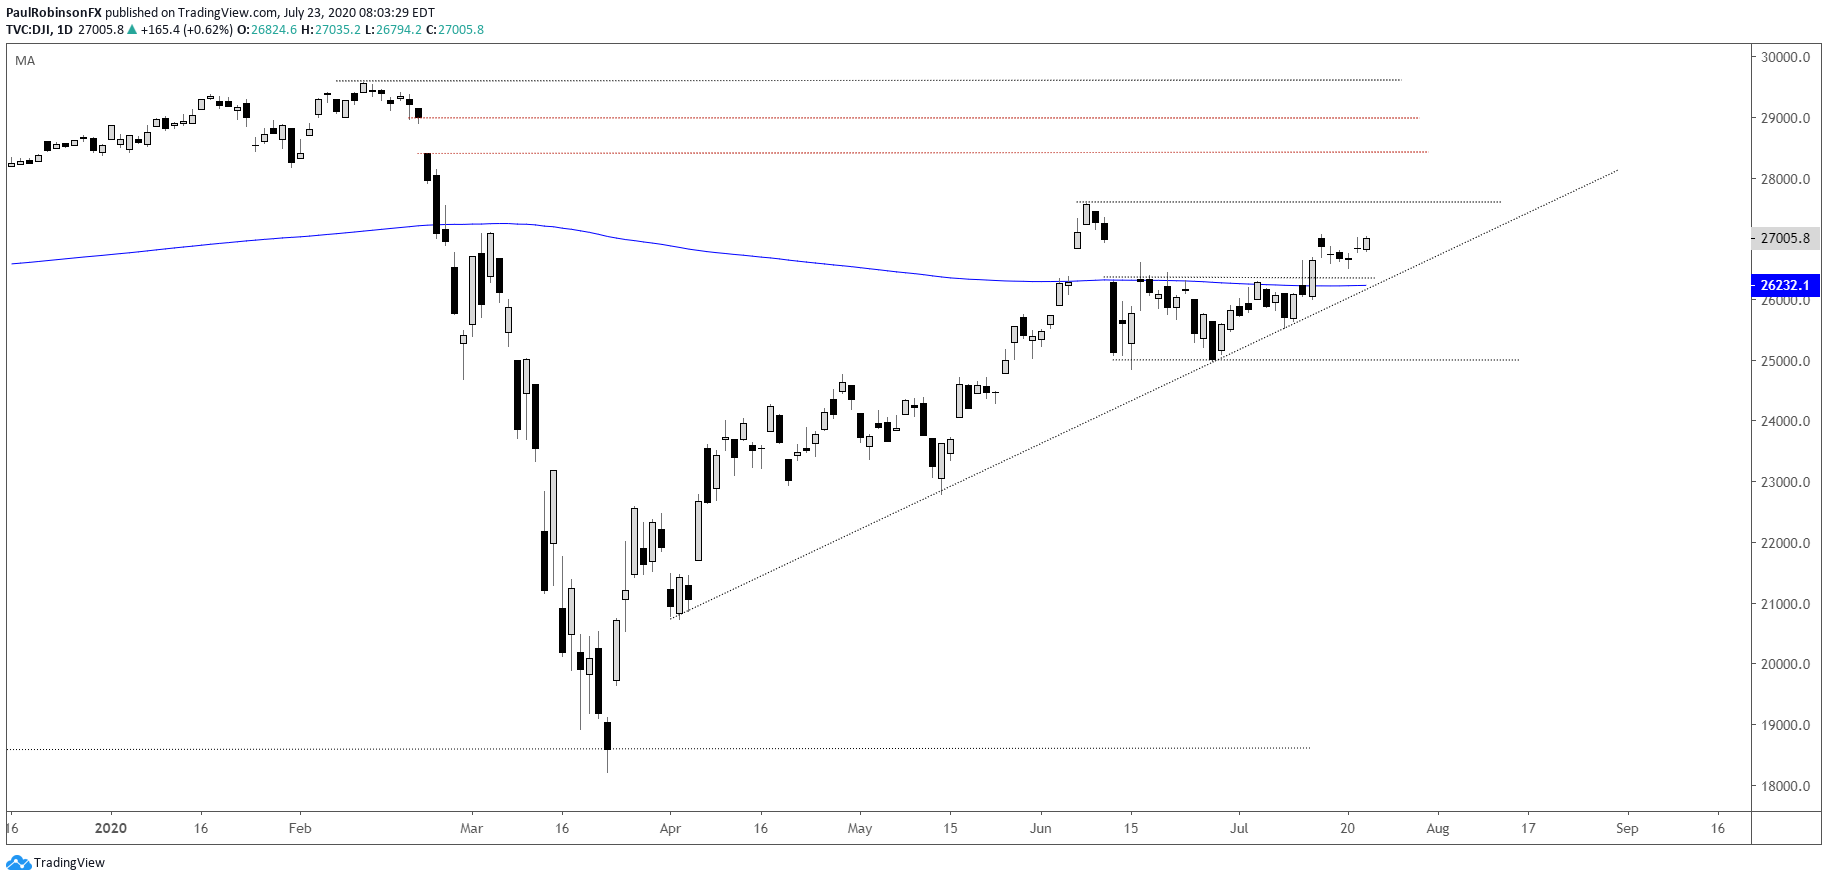
Dow Jones Chart by TradingView
The Nasdaq 100 is close to a new record high, which has been the case for nearly two months on a consistent basis. Roughly half the index is made up of only six stocks (FB, APPL, MSFT, AMZN, GOOG, TSLA), which makes it a pretty top-heavy index. For now as long as these momentum stocks keep dong their thing then so will the NDX, but slip up and that will change. Earnings the next couple of weeks could prove pivotal if there is a common theme amongst these stocks as they report.
The 100 is currently sitting outside of the bull channel dating back to 2010. When price leaves the confines of a structure of this nature things can turn violent as orderly gives way to disorderly. At some point the rally will let up, but for now the trend remains our friend. A break back inside the long-term channel will make the recent leg of the rally an ‘overthrow’ and act as a signal that a broader decline may be ready to get underway. For this to happen we would need to see the NDX trade below roughly 10150.
Nasdaq 100 Daily Chart (holding strong still)

Nasdaq 100 Chart by TradingView
Nasdaq 100 Weekly Chart (outside bull channel)

Nasdaq 100 Chart by TradingView
Resources for Forex Traders
Whether you are a new or experienced trader, we have several resources available to help you; indicator for tracking trader sentiment, quarterly trading forecasts, analytical and educational webinars held daily, trading guides to help you improve trading performance, and one specifically for those who are new to forex.
---Written by Paul Robinson, Market Analyst
You can follow Paul on Twitter at @PaulRobinsonFX


