


S&P 500 Index Technical Price Outlook: SPX500 Near-term Trade Levels
- S&P 500 Index updated technical trade levels & sentiment – Daily & 120min Charts
- SPX500 rally stalls at near-term resistance– immediate focus is on break of 3118-3181 range
- What is S&P 500? A Guide to the S&P 500 Index
The S&P 500 Index is attempting a second consecutive weekly advance but continues to hold below a critical resistance barrier. The focus is on a break of the monthly opening range with the advance vulnerable into key resistance just higher. These are the updated targets and invalidation levels that matter on the SPX500 technical price charts. Review my latest Weekly Strategy Webinar for an in-depth breakdown of this S&P 500 trade setup and more.
S&P 500 Price Chart – SPX500 Daily
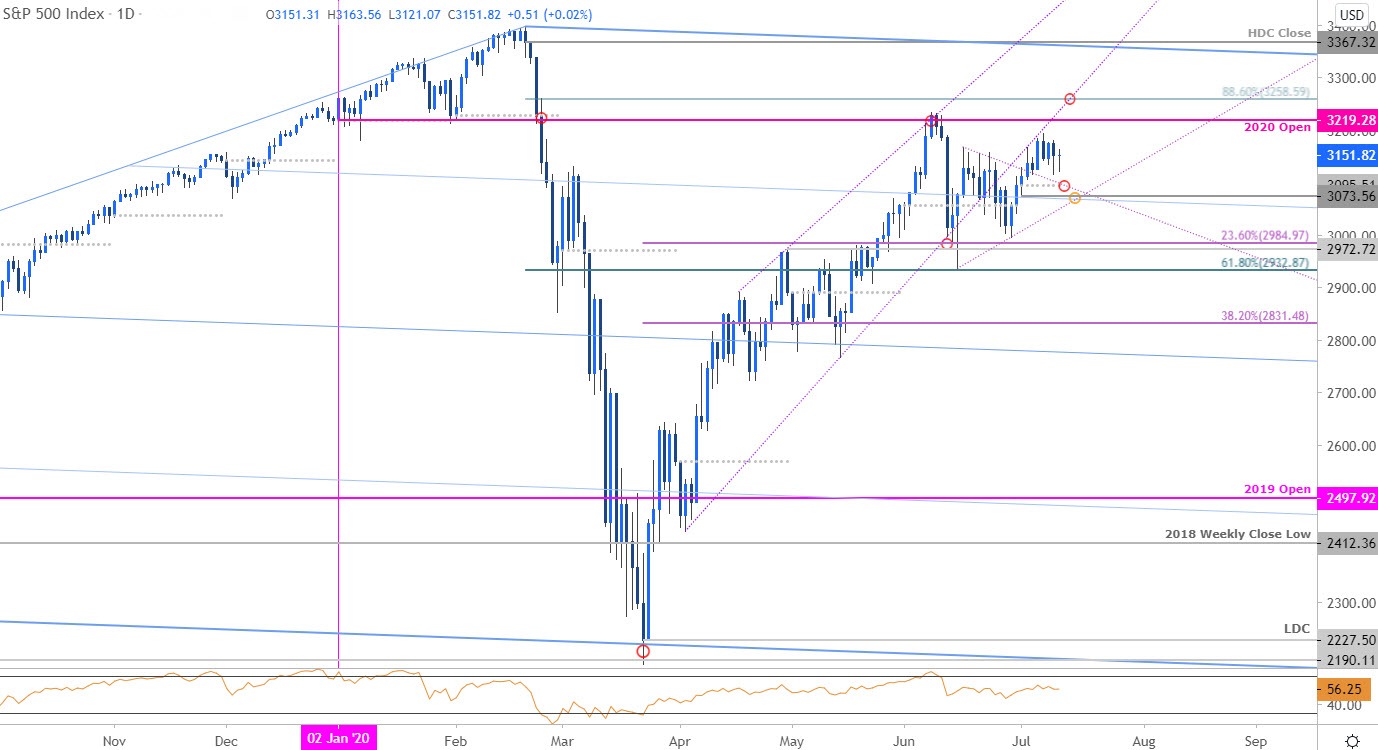
Chart Prepared by Michael Boutros, Technical Strategist; S&P 500 Index on Tradingview
Technical Outlook: In my last S&P 500 Price Outlook we noted that the index had “reversed off yearly open resistance and the threat remains for a deeper correction near-term while below 3181.” Price continued lower in the following days with a decline of more than 9% off the June highs registering a low at 2935 before rebounding. A break below the April trendline has price testing this slope as resistance into the open of June trade with the monthly opening-range taking shape just below.
Monthly open support rests at 3095 with a break of the range lows at 3073 risking a larger correction in price. Key resistance steady at the yearly open / 100% ext at 3219/26 with a close above 3258 needed to mark resumption of the broader uptrend.
S&P 500 Price Chart – SPX500 120min
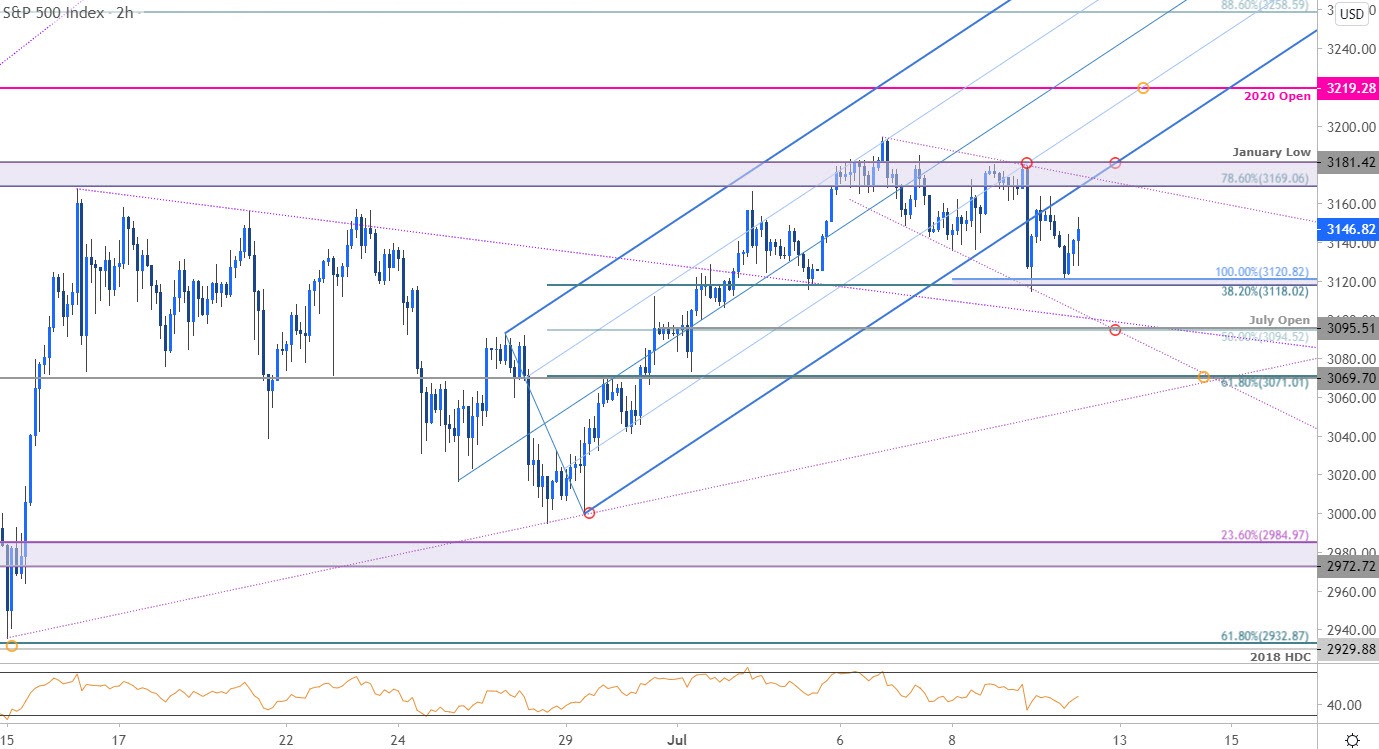
Notes: A closer look at S&P 500 price action shows the index breaking below an ascending pitchfork formation we’ve been tracking since last month. Yesterday’s sell-off rebounded off confluence support at the 38.2% retracement / 100% extension at 3118/20 and the focus is on this recovery. Resistance steady at 3169/81- look for exhaustion into this region IF price is indeed heading lower. A close above is needed to keep the focus on the yearly open at 3219. A break lower exposes the monthly open / 50% retracement at 3094/95 backed by 3069/70- look for a larger reaction there IF reached.

Bottom line: The S&P 500 is carving a monthly opening-range just above the objective July open at 3095 – look to the break for guidance. From at trading standpoint, the immediate focus is on a breakout of this expansionary range off the highs with the broader rally vulnerable sub-3181 – look for a move lower to offer more favorable opportunities with a breach above the yearly open ultimately needed to keep fuel the next leg higher.
For a complete breakdown of Michael’s trading strategy, review his Foundations of Technical Analysis series on Building a Trading Strategy
S&P 500 Trader Sentiment – SPX500 Price Chart
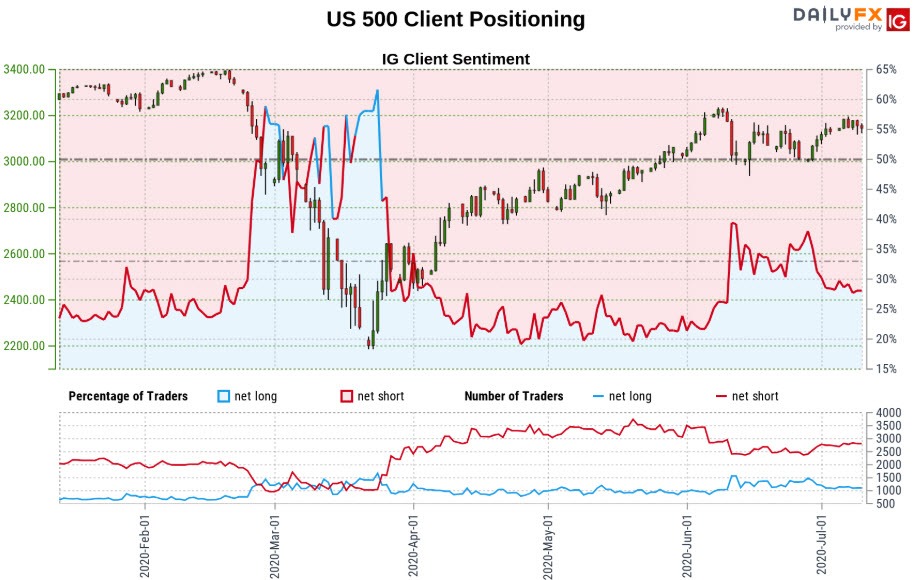
- A summary of IG Client Sentiment shows traders are net-short the index - the ratio stands at -2.41 (29.3% of traders are long) – bullishreading
- Long positions are1.61% higher than yesterday and 1.89% higher from last week
- Short positions are 2.74% lower than yesterday and 1.34% lower from last week
- We typically take a contrarian view to crowd sentiment, and the fact traders are net-short suggests US 500 prices may continue to rise. Yet traders are less net-short than yesterday and compared with last week. Recent changes in sentiment warn that the current S&P 500 price trend may soon reverse lower despite the fact traders remain net-short
| Change in | Longs | Shorts | OI |
| Daily | 16% | -9% | 1% |
| Weekly | 19% | -16% | -4% |
---
Active Trade Setups
- Gold Price Technical Outlook: XAU/USD Soars to Nine-Year Highs
- Australian Dollar Price Outlook: Aussie Rally Flies Towards 2020 High
- Dollar vs Mexican Peso Price Outlook: USD/MXN Rally to be Short Lived
- Euro Price Outlook: EUR/USD at Technical Support Pivot into July Open
- Sterling Technical Price Outlook: British Pound Reacts at Resistance
- Written by Michael Boutros, Currency Strategist with DailyFX
Follow Michael on Twitter @MBForex


