


U.S. Indices Highlights:
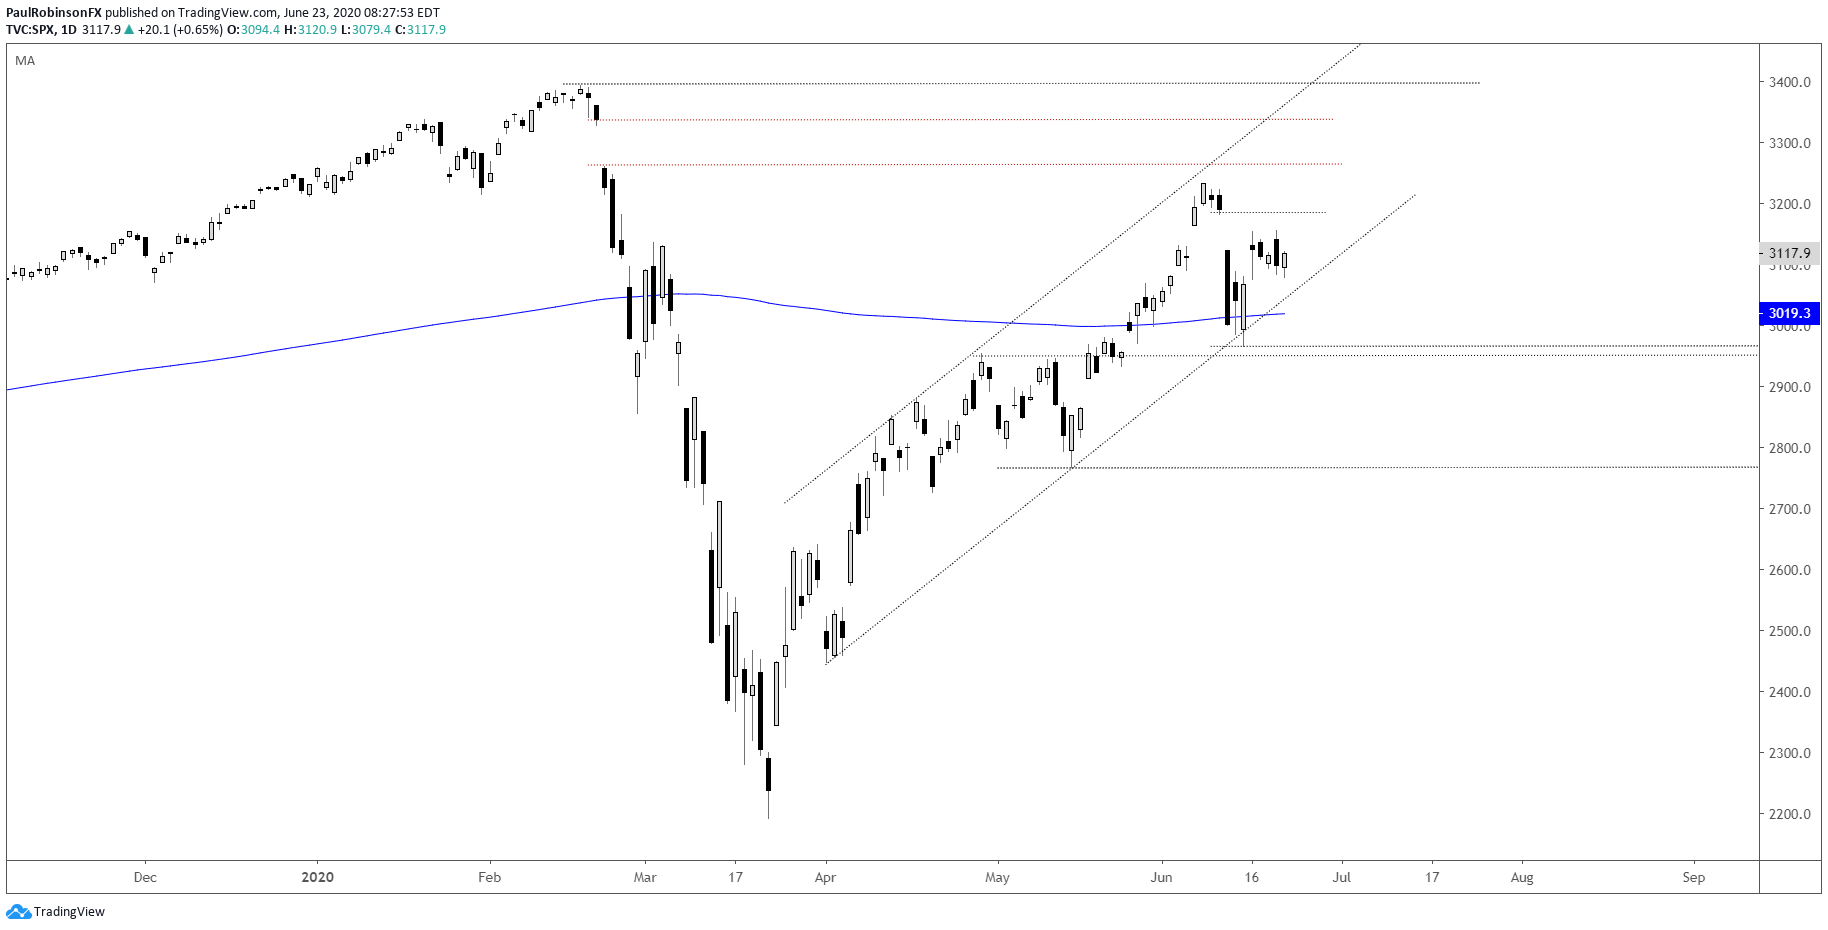
- S&P 500 continuing to hold channel structure
- Nasdaq 100 testing top of long-term channel again
- Dow Jones leaning on trend-line support
U.S. stocks are remining firm even if at times they have wobbled in recent trade. The S&P 500 is staying contained within an upward channel structure and holding onto the 200-day moving average. As long as the channel structure is maintained then so does a neutral to bullish bias. The Nasdaq 100 needs to be watched closely here, given that it is home to the largest companies in the S&P 500 as well, thus largely dominates market direction.
S&P 500 Daily Chart (staying within channel)
The Nasdaq 100 is pressing up against the top of the long-term bull market channel. This is a spot we have seen act as a significant inflection point on several prior occasions. While we already saw a hard turn down this month from it, it wasn’t quite the topping event anticipated given it is was basically a one-day event. There is still time for a larger downturn to develop, with the alternative being that we see the NDX take off outside of the channel and turn in a blow-off rally. This latter scenario seems the least likely of the two, but one we may need to consider.
For sellers to gain traction, the shorter-term upward channel structure needs to break to give shorts a shot at a larger decline. This will make for the safest bet in going against what has been a difficult market to be short of for more than a couple of days. Stay inside the near-term channel and the outlook is neutral to bullish, but break the lower parallel and the NDX has a shot at validating a decline off the long-term channel as another significant turning point. This will of course have broad market ramifications not only in the U.S., but abroad.
Nasdaq 100 Weekly Chart (top of bull channel)

Nasdaq 100 Chart by TradingView
Nasdaq 100 Daily Chart (near-term channel)

Nasdaq 100 Chart by TradingView
The Dow Jones is sitting on the trend-line from the March low, lagging behind. Same deal here, stay above support and the outlook is neutral to bullish. Strength could bring in gap-fills at some point if the monthly high at 27580 can be broken. A break of trend support and the recent low at 24843 will have the index on its backfoot. Again, keep an eye on the NDX and SPX here, even if the Dow breaks these it could stay bid and have limited downside. The bottom line is we need the leaders to crack for the Dow to sell off.
Dow Jones Daily Chart (trend-line support)

Dow Jones Chart by TradingView
Resources for Forex Traders
Whether you are a new or experienced trader, we have several resources available to help you; indicator for tracking trader sentiment, quarterly trading forecasts, analytical and educational webinars held daily, trading guides to help you improve trading performance, and one specifically for those who are new to forex.
---Written by Paul Robinson, Market Analyst
You can follow Paul on Twitter at @PaulRobinsonFX


