


S&P 500 Index Technical Price Outlook: SPX500 Near-term Trade Levels
- S&P 500 Index updated technical trade levels & sentiment – Daily & 120min Charts
- SPX500 beaks confluence uptrend support - plummets for a third consecutive day
- What is S&P 500? A Guide to the S&P 500 Index
The S&P 500 Index plummeted more than 5% from the monthly high with price turning sharply lower from yearly open resistance. So is this just a near-term washout or is a larger correction underway? These are the updated targets and invalidation levels that matter on the SPX500 technical price charts. Review my latest Weekly Strategy Webinar for an in-depth breakdown of this S&P 500 trade setup and more.
S&P 500 Price Chart – SPX500 Daily
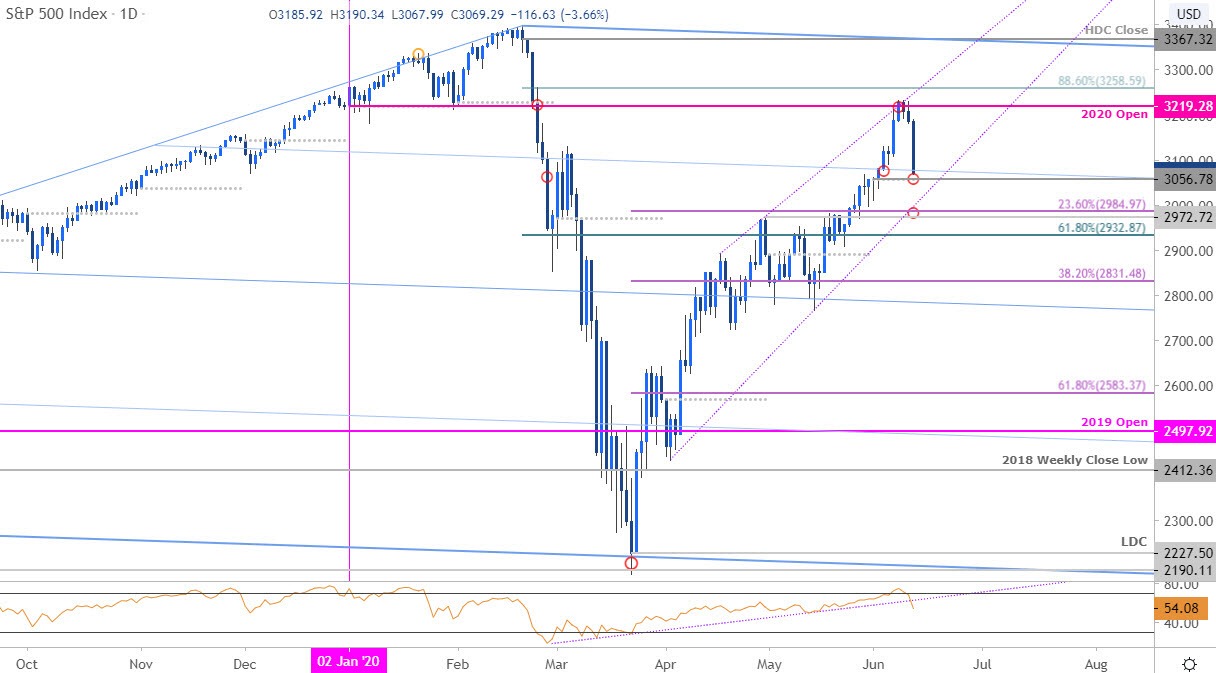
Chart Prepared by Michael Boutros, Technical Strategist; S&P 500 Index on Tradingview
Technical Outlook: In my last S&P 500 Price Outlook we highlighted that the SPX advance was approaching near-term resistance into the close of the month around 3069 while noting that a, “breach higher from here exposes subsequent topside resistance objectives at 3137 and the yearly open at 3219.” Price briefly registered a high just above this threshold at 3233 early in the week before turning with the index taking another leg lower today in New York.
Monthly open support rests at 3057 backed by key support at the April high / 23.6% retracement of March rally at 2972/84- look for a larger reaction there IF reached. A topside breach / close above 3219 would be needed to mark resumption toward 3259 and the yearly high-day close at 3367.
S&P 500 Price Chart – SPX500 120min
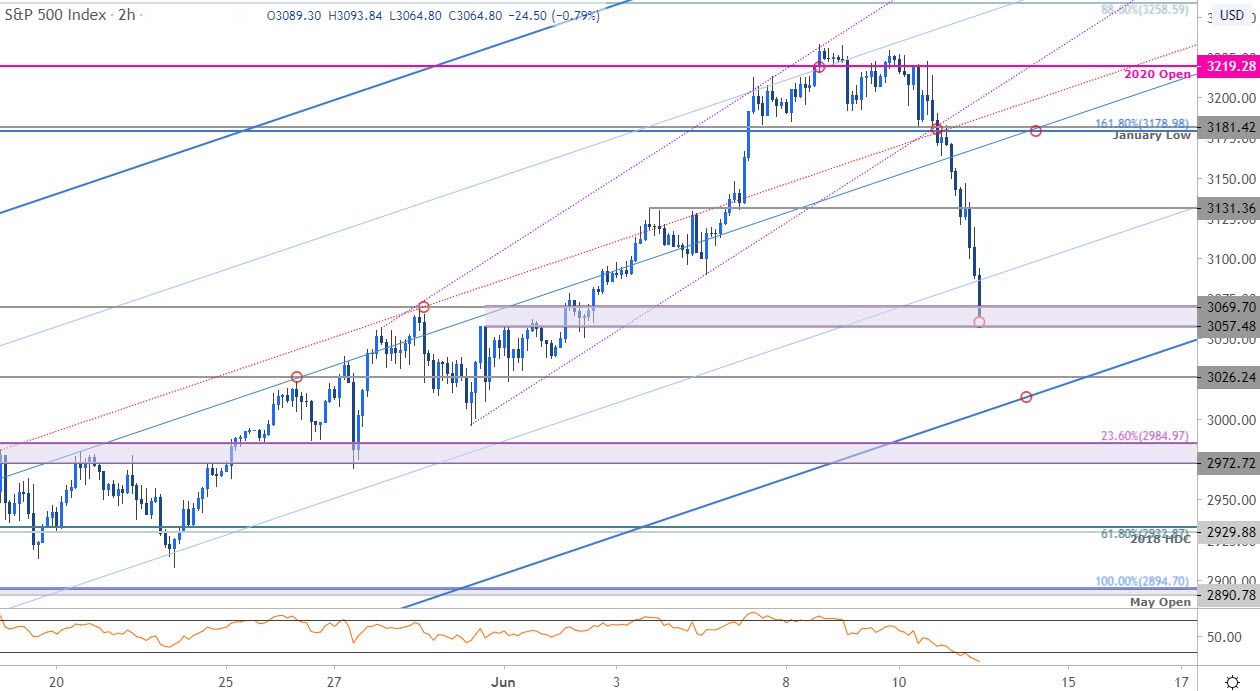
Notes: A closer look at S&P 500 price action shows the index continuing to trade within the confines of an ascending pitchfork formation we’ve been tracking for weeks now. Price failed at the 75% parallel with a break below confluence uptrend support / the median-line accelerating the decline today. Look for a close below 3057 to keep the immediate short-bias viable with subsequent support objectives eyed at 3026 and the lower parallel (currently ~3005). Initial resistance now 3131 with near-term bearish invalidation lowered to 3179/81.

Bottom line: The S&P 500 reversed off yearly open resistance this week and the threat remains for a deeper correction near-term while below 3181. From a trading standpoint, a good zone to reduce short-exposure / lower protective stops – look to the close for guidance. Ultimately, a move lower may offer more favorable entries closer to broader uptrend support. Weakness beyond 2972 would suggest a larger correction is underway in the S&P 500.
For a complete breakdown of Michael’s trading strategy, review his Foundations of Technical Analysis series on Building a Trading Strategy
S&P 500 Trader Sentiment – SPX500 Price Chart
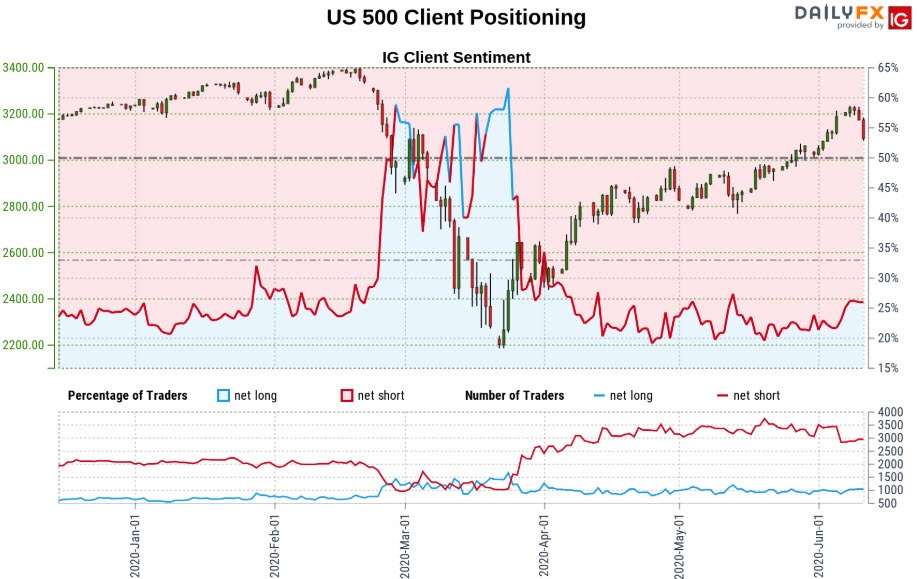
- A summary of IG Client Sentiment shows traders are net-short the index - the ratio stands at -2.20 (31.29% of traders are long) – bullishreading
- Long positions are8.76% higher than yesterday and 15.43% higher from last week
- Short positions are 5.39% lower than yesterday and 18.75% lower from last week
- We typically take a contrarian view to crowd sentiment, and the fact traders are net-short suggests US 500 prices may continue to rise. Yet traders are less net-short than yesterday and compared with last week. The recent changes in sentiment warn that the current S&P 500 price trend may soon reverse lower despite the fact traders remain net-short
| Change in | Longs | Shorts | OI |
| Daily | 2% | -7% | -3% |
| Weekly | 18% | -19% | -4% |
---
Active Trade Setups
- Canadian Dollar Technical Price Outlook: USD/CAD Recovery Underway
- Gold Price Technical Outlook: XAU/USD Recovery Faces Trend Resistance
- Australian Dollar Price Outlook: Aussie Breakout Stalls at 2020 Open
- Dollar Price Outlook: USD Technical Breakdown at Yearly Open Support
- Yen Technical Price Outlook: USD/JPY Breakout Testing Trend Extremes
- Dollar vs Mexican Peso Technical Outlook: USD/MXN Breakdown Levels
- Written by Michael Boutros, Currency Strategist with DailyFX
Follow Michael on Twitter @MBForex


