


Dow Jones & S&P 500 Highlights:
Dow Jones & S&P 500 risk is rising
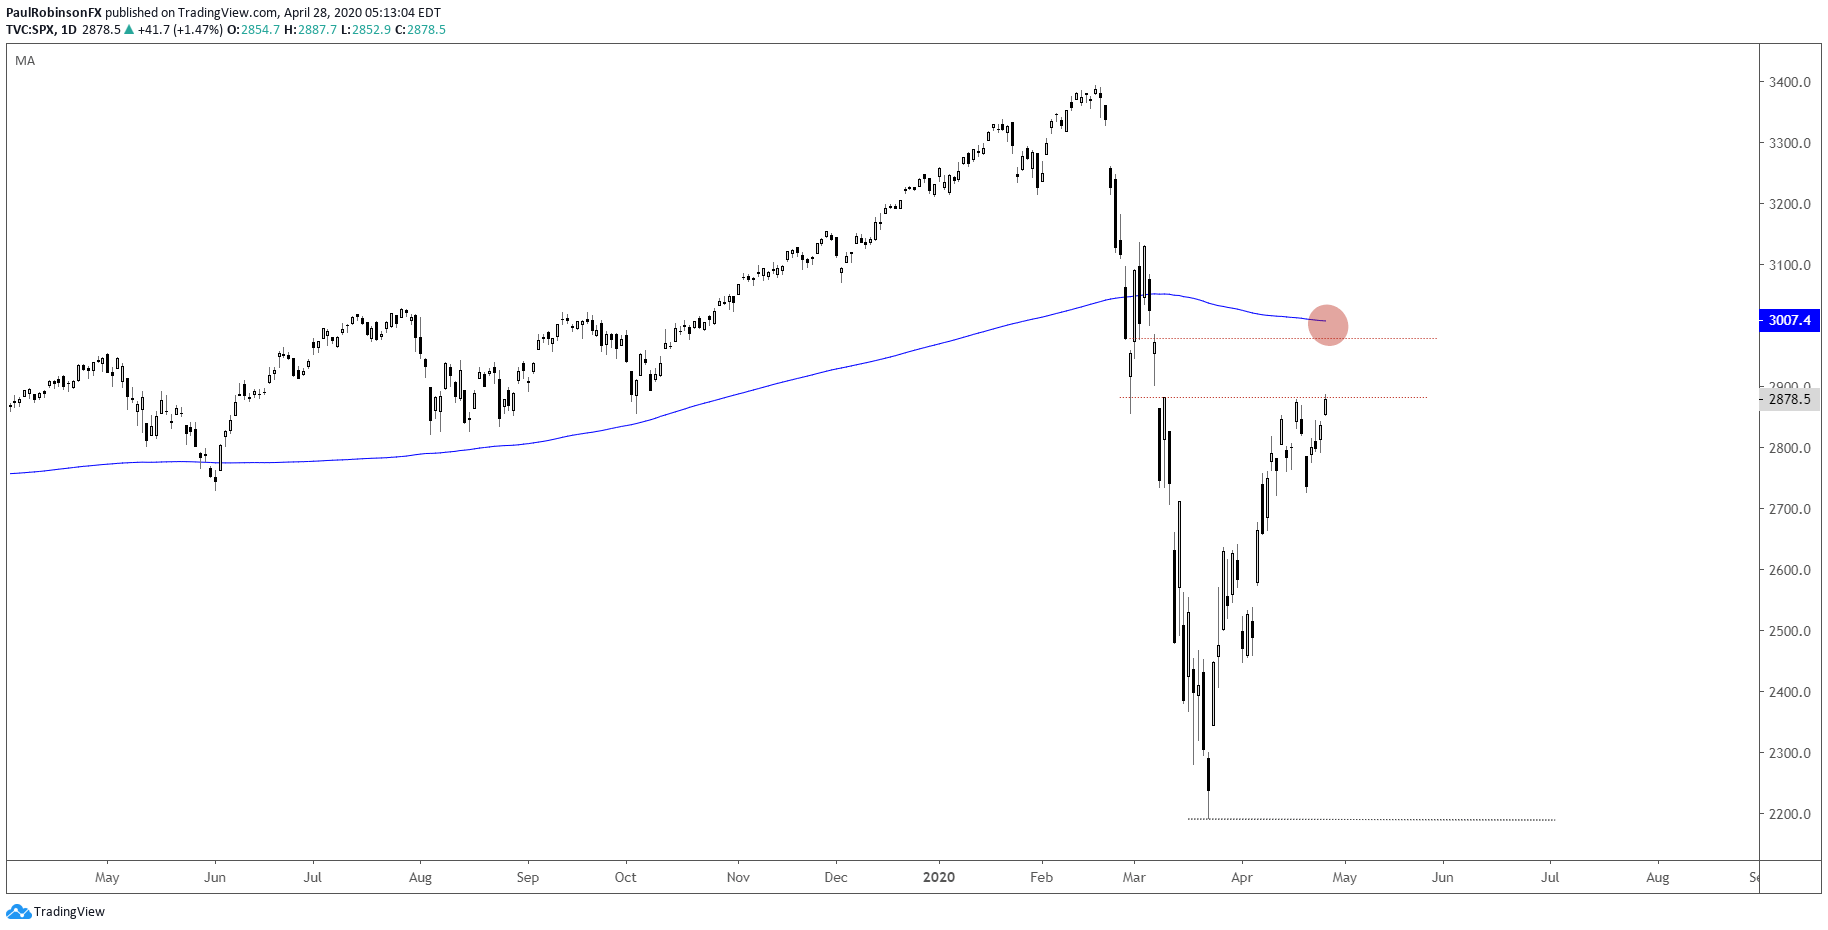
The rally in US equities has been tremendous so far with of course the help of trillions of dollars in Fed support. The S&P 500 is currently reaching towards the gap territory from Friday, March 6 to the March 9 Monday opening. To fill it a rally to 2972 needs to materialize. Just beyond there the 200-day clocks in just above the 3k mark (3007 right now).
At the rate things are going it seems likely the S&P trades up to resistance before running into a potential problem, but that doesn’t make risk/reward particularly favorable for a swing-trade. Short-term trades (i.e. day-trades) may have the path of least resistance on their side, but otherwise the rally is beginning to run the risk of running out of steam as major levels reside just ahead.
For now, continuing to respect the upward trajectory since last month’s low. A run into the aforementioned levels may warrant flipping the script to shorts.

S&P 500 Daily Chart (Gap-fill, 200-day ahead)
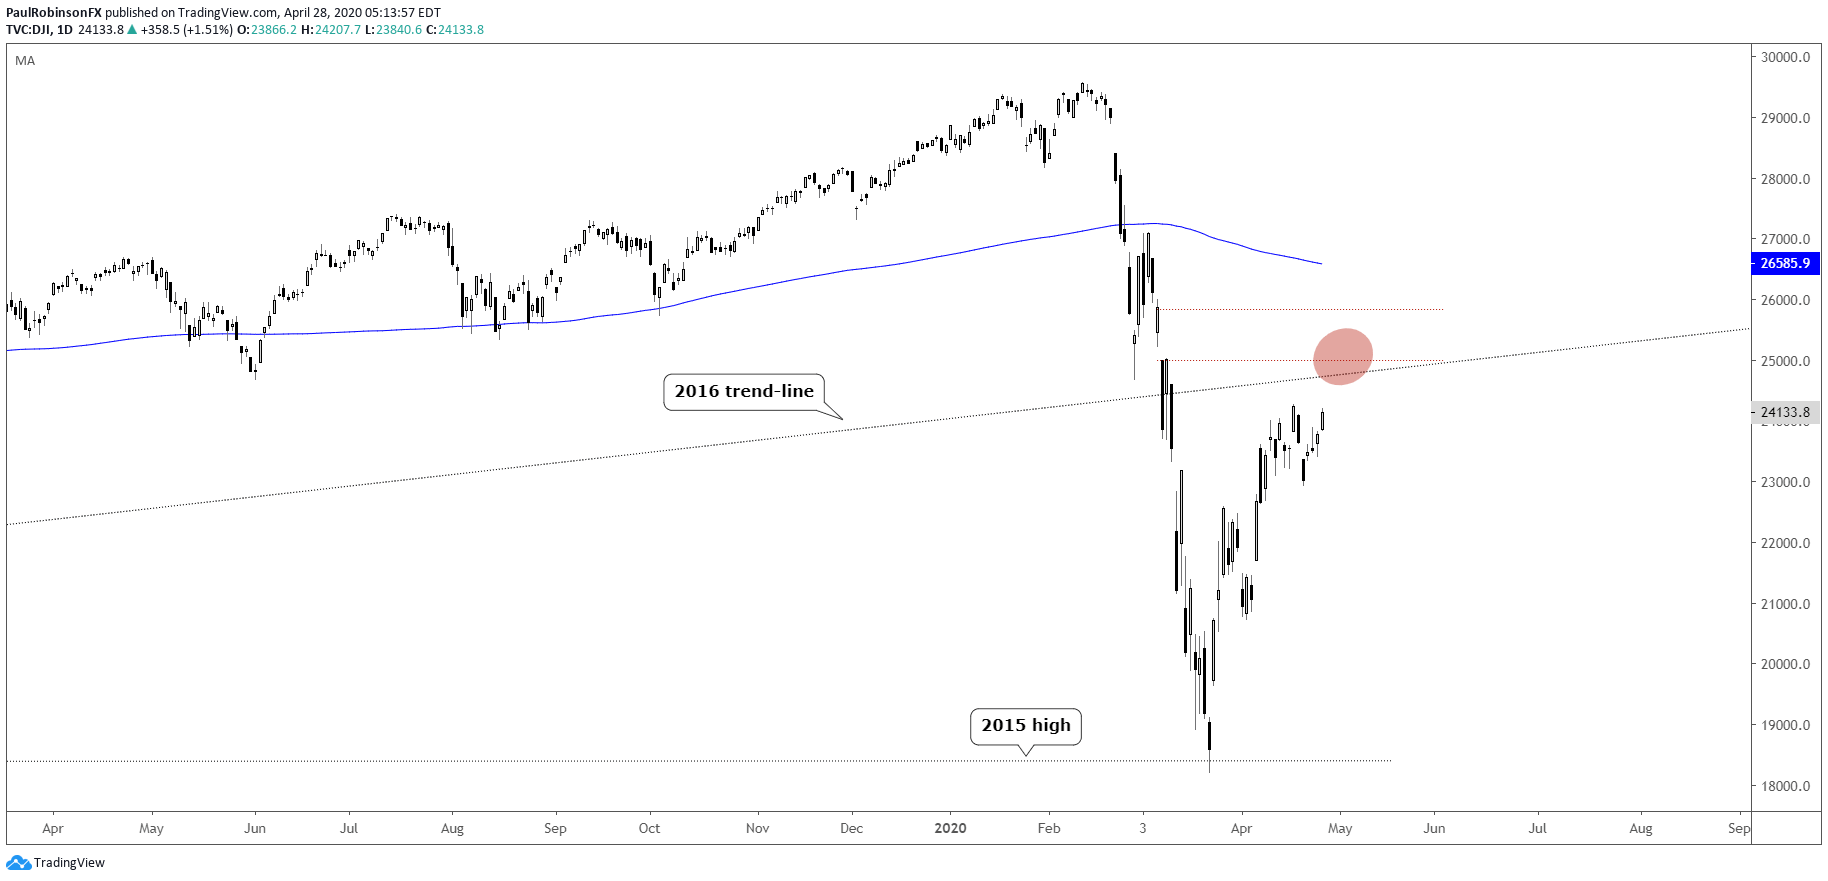
The Dow Jones hasn’t been as strong as the S&P, but nevertheless the rally will continue with it for as long as it can run its course. The underside of the 2016 trend-line is worth paying attention to as it nears, and then beyond there the gap-fill in early March from 25021 up to 25864. Given the distance, the Dow may not make it to the 200-day on this trip if the S&P 500 hits its respective 200-day.
Dow Jones Daily Chart (gap, 2016 trend-line)
Resources for Forex Traders
Whether you are a new or experienced trader, we have several resources available to help you; indicator for tracking trader sentiment, quarterly trading forecasts, analytical and educational webinars held daily, trading guides to help you improve trading performance, and one specifically for those who are new to forex.
---Written by Paul Robinson, Market Analyst
You can follow Paul on Twitter at @PaulRobinsonFX


