


S&P 500 Index Technical Price Outlook: SPX500 Trade Levels
- S&P 500 Index updated technical trade levels & sentiment – Daily Chart
- Coronavirus stock sell-off plummets through long-term uptrend support- index in correction
- What is S&P 500? A Guide to the S&P 500 Index
The S&P 500 Index is in correction territory with the index plummeting more than 11.4% off the record highs in just six days before stabilizing. While the Coronavirus threat continues to roil market sentiment, the index may be at a point of near-term exhaustion and leaves the immediate short-bias vulnerable while above near-term confluence support. These are the updated targets and invalidation levels that matter on the SPX500 technical price chart. Review my latest Weekly Strategy Webinar for an in-depth breakdown of this SPX500 trade setup and more.
S&P 500 Price Chart – SPX500 Daily
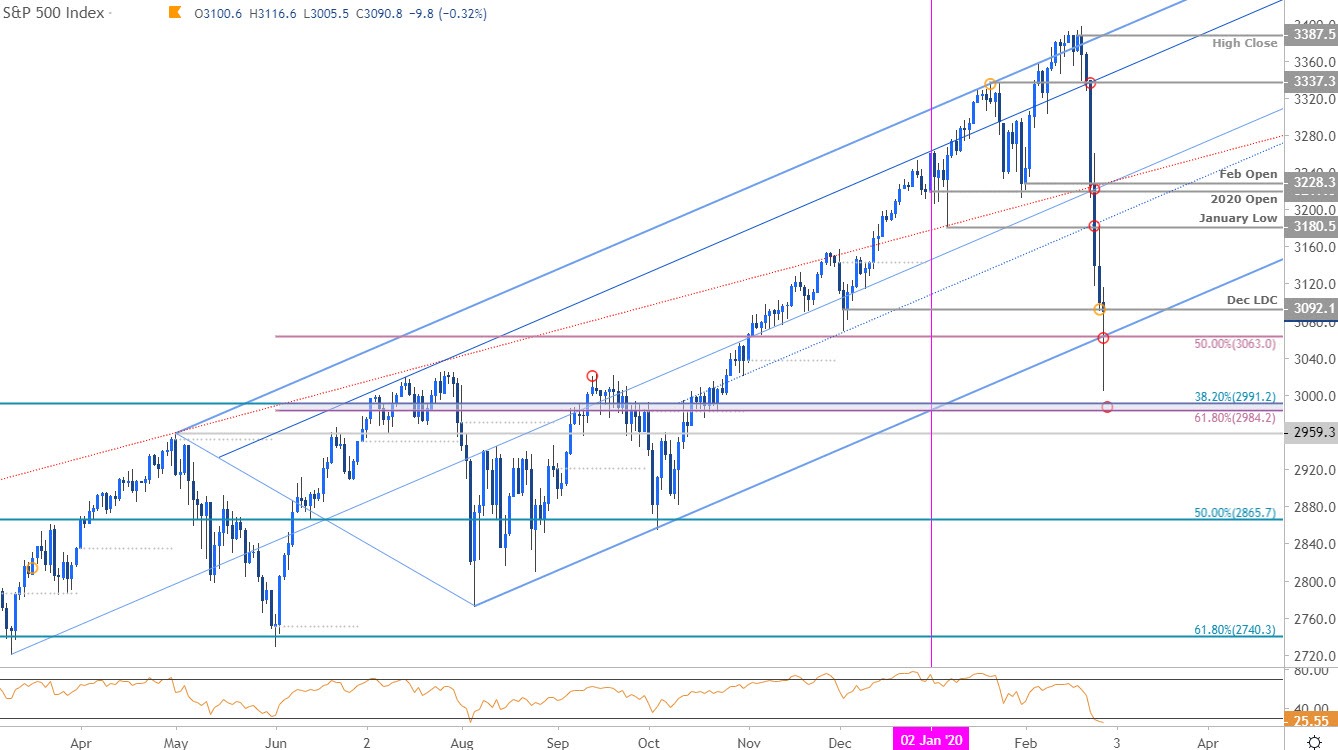
Chart Prepared by Michael Boutros, Technical Strategist; S&P 500 Index on Tradingview
Technical Outlook:In my last S&P 500 Price Outlook we noted that the index was approaching, “uptrend resistance and the focus is on a reaction just higher. From a trading standpoint, the immediate long-bias may be vulnerable heading into this zone.” Price registered a high just above pitchfork resistance at 3397 on February 20th before posting an outside-day reversal into the close. The sell-off continued to intensify on growing concerns over the Coronavirus epidemic with the stocks poised to mark the largest weekly loss since the 2008 Financial Crisis.
A six-day sell-off saw the S&P 500 plummet to multi-month lows before pulling back with the index currently trading just above confluence support at 3063- a level defined by the 50% retracement of the June advance and converges on the lower parallel. A close below this level would highlight the risk for further losses with such a scenario exposing subsequent support objectives at 2987/91 and the May swing high at 2959. Initial resistance now eyed at the December low-day close at 3092 with broader bearish invalidation at January opening-range low at 3180.

Bottom line: The S&P 500 index testing uptrend support here after paring half of the May rally- watch the weekly close here. Weakness beyond threshold would keep the focus on a more meaningful reaction down near 2984/91. Keep in mind that the momentum profile remains in favor of the bears and we’ll need to see ample evidence in near-term price before attempting to fight this decline- that said, we’re on the lookout for signs of an exhaustion low near-term- watch the weekly close with respect to this slope. I’ll publish and updated S&P500 Price Outlook once we get further clarity on the near-term SPX technical trade levels.
For a complete breakdown of Michael’s trading strategy, review his Foundations of Technical Analysis series on Building a Trading Strategy
S&P 500 Trader Sentiment – SPX500 Price Chart
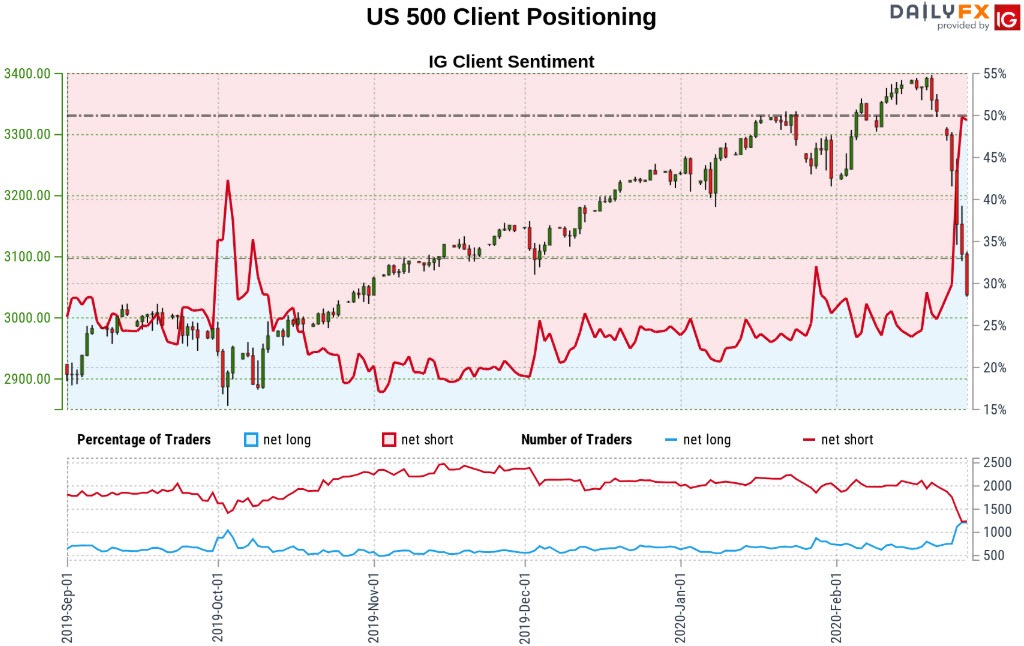
- A summary of IG Client Sentiment shows traders are net-short the index - the ratio stands at -1.07 (48.26% of traders are long) – neutral reading
- Long positions are5.60% higher than yesterday and 59.80% higher from last week
- Short positions are 5.53% higher than yesterday and 33.09% lower from last week
- We typically take a contrarian view to crowd sentiment, and the fact traders are net-short suggests US 500 prices may continue to rise. Yet traders are less net-short than yesterday & compared with last week and the recent changes in sentiment warn that the current S&P 500 price trend may soon reverse lower despite the fact traders remain net-short.
| Change in | Longs | Shorts | OI |
| Daily | -5% | 0% | -3% |
| Weekly | 23% | -14% | 1% |
---
Active Trade Setups
- Canadian Dollar Price Outlook: USD/CAD Breakout Targets Trend Extreme
- Gold Price Outlook: XAU/USD Coronavirus Breakout Fizzles- GLD Levels
- Sterling Price Outlook: British Pound Threatens GBP/USD Breakout
- Oil Price Outlook: Crude Slips into Support– WTI Trade Levels
- Euro Price Outlook: EUR/USD Spirals into Support– Trade Levels
- Written by Michael Boutros, Currency Strategist with DailyFX
Follow Michael on Twitter @MBForex


