


U.S. Indices Technical Outlook:
- S&P 500 very close to record, 2018 t-line
- Dow Jones also in a battle around a new record
- Nasdaq 100 lagging behind a little, getting squeezed
See how the quarterly forecast has played out what it could mean for the big-picture – Q3 Equity Markets Forecast.
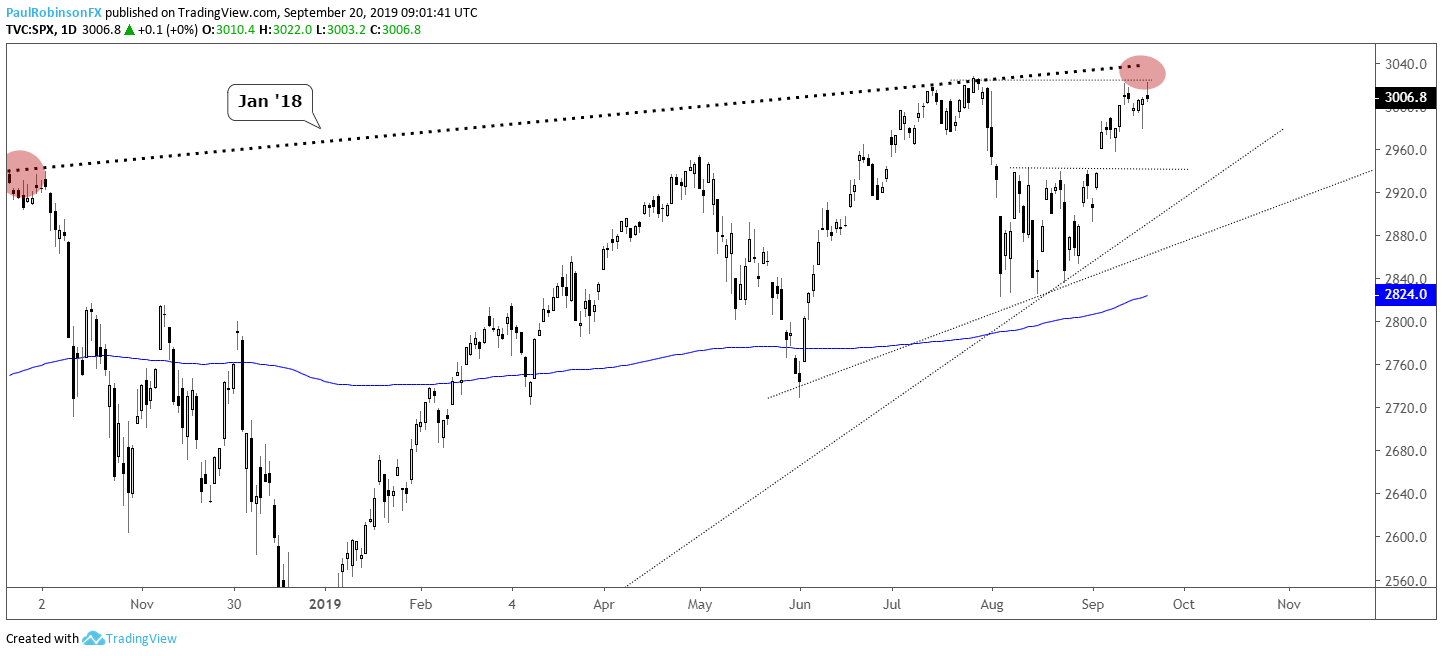
S&P 500 very close to record, 2018 t-line
The S&P 500 continues to have its difficulties around the record high situated at 3028. The sideways movement we are seeing could end up as a consolidation that sees the market through, or it could be the churn before the drop.
Running with a bullish bias beyond the record high presents some issues as the January 2018 top-side trend-line runs across. The fact there is resistance so close takes some appeal away from fresh longs, however, shorts aren’t most appealing either given we have yet to see any real bearish price action.
That may change and price could swing lower with force and give the upper hand to shorts, but until it does so the trend is still higher. The technical picture should clear up shortly given the thresholds the market sits around, but some patience in the meantime may be required.
Check out the IG Client Sentiment page to see how retail traders are positioned and what it could potentially mean for various currencies and markets moving forward.
S&P 500 Daily Chart (record highs, top-side 2018 t-line)
The Dow has the 27398-record high level and 2018 top-side trend-line in very close proximity to one another, effectively amounting to confluence. The confluent resistance needs to be cleared to give the market a chance at rallying, but should it turn down sharply there is some room to drop with no significant price support close by.
Dow Jones Daily Chart (confluent resistance)
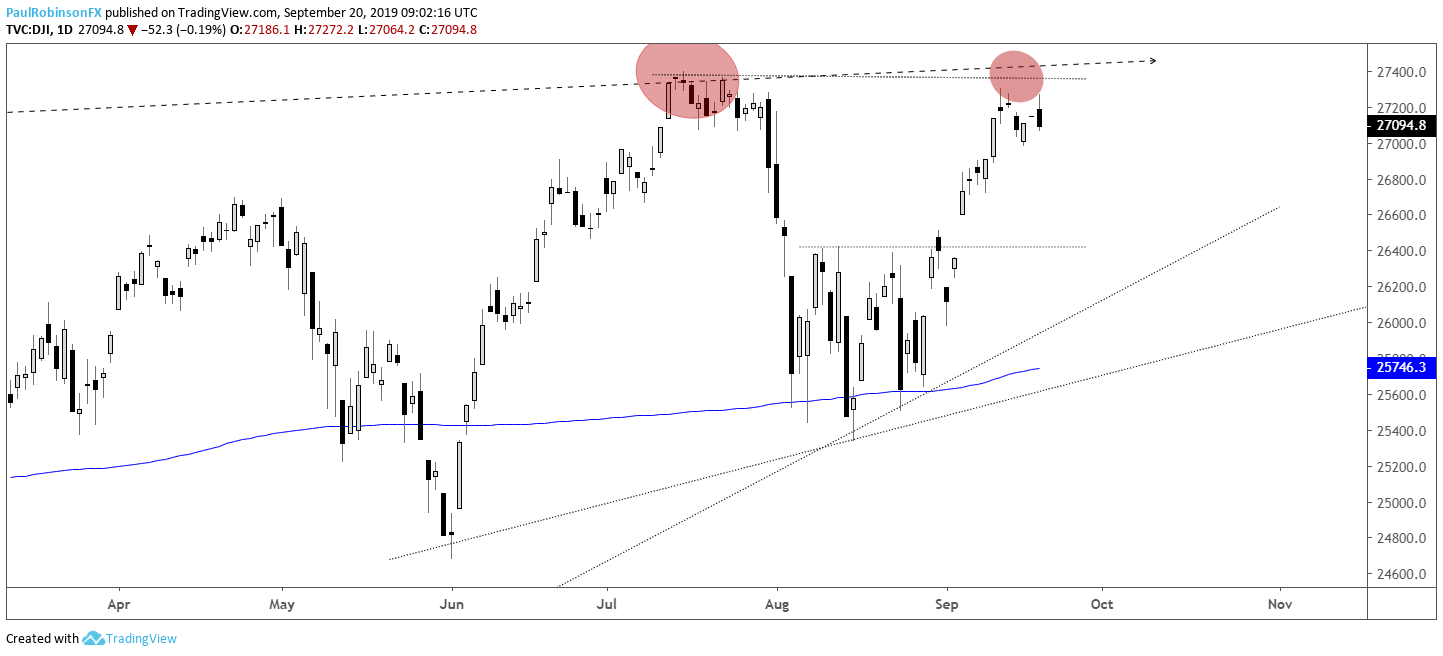
Dow Jones Chart by Tradingview
What is most interesting about the Nasdaq 100 chart is the large rising wedge formation under development since last year. Price is running out of real estate with it quickly drawing towards the apex of the pattern.
In the near-term the NDX will go the way of the broader market, but with it home to some of the World’s largest and most ‘loved’ stocks (Facebook, Apple, Amazon, Netflix, Google – FAANG), it could be the leader of any major big-picture move that happens.
The large rising wedge after an extended uptrend suggests a downside break is coming, but we will not need to concern ourselves with that until the bottom-side trend-line of the pattern from December is firmly broken.
Nasdaq 100 Daily Chart (wedge nearing apex)

Nasdaq 100 Chart by Tradingview
To learn more about U.S. indices, check out “The Difference between Dow, Nasdaq, and S&P 500: Major Facts & Opportunities.” You can join me every Wednesday at 10 GMT for live analysis on equity indices and commodities, and for the remaining roster of live events, check out the webinar calendar.
Tools for Forex & CFD Traders
Whether you are a beginning or experienced trader, DailyFX has several resources available to help you; indicator for tracking trader sentiment, quarterly trading forecasts, analytical and educational webinars held daily, trading guides to help you improve trading performance, and one specifically for those who are new to forex.
---Written by Paul Robinson, Market Analyst
You can follow Paul on Twitter at @PaulRobinsonFX


