


Dow Jones Technical Forecast
- Alongside the S&P 500 and Nasdaq, the Dow Jones finds itself within reach of all-time highs
- The upcoming week is filled with fundamental events that possess significant potential to spur a break
- Learn key tips and tricks to Day-Trading the Dow Jones
Dow Jones Technical Forecast: DJIA May Grasp at Record Highs
The Dow Jones Industrial Average traded slightly higher on Wednesday as traders await Thursday’s European Central Bank decision. The rate decision is widely expected to deliver a dovish framework for the coming months which could in turn, boost the DJIA further. Similarly, next Wednesday’s Fed meeting is also expected to offer an appetizing monetary policy outlook which has likely been a critical portion of the Dow’s performance in the year-to-date. With the fundamental expectations locked in, it is now up to the delivery of the events and technical levels to influence the follow-through of the various Indices.
Dow Jones Price Chart: 4 - Hour Time Frame (June – September) (Chart 1)
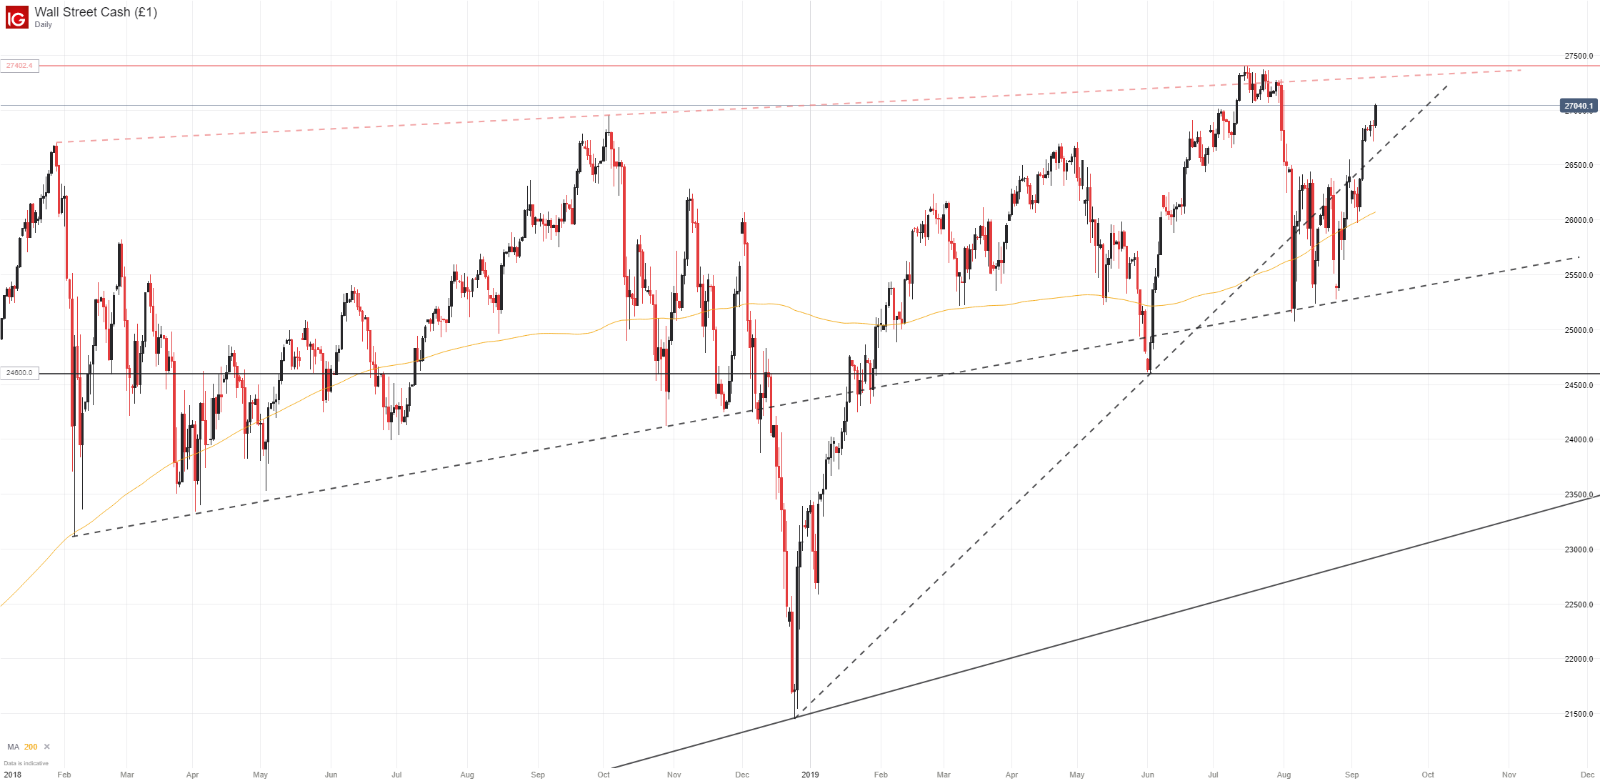
That said, the DJIA trades in proximity to levels that possess major technical merit. To the topside, all-time highs around 27,400 and an ascending trendline marked by the highs from January 2018 and October 2018 slightly prior, will look to offer staunch resistance. If market expectations are fulfilled, bullishness could take hold and drive the Dow to test these heights.
Dow Jones Price Chart: Daily Time Frame (January 2018 – September 2019) (Chart 2)

On the other hand, a disappointing meeting from either the ECB, Fed or both, could seriously inhibit an attempted move higher. In turn, the Dow Jones could threaten a breakdown back into the August range and potentially threaten the ascending trendline from February 2018. The line has influenced price throughout the last 20 months and helped to create the lower-bound of the recent range around 25,200. Apart from the February trendline, the area also marks a zone of confluence for various other technical levels.
Check out the Weekly Fundamental Forecast for the Dow Jones, Nasdaq 100, DAX 30 and FTSE 100.
Thus, if dovish expectations are not met, the area could effectively be viewed as the “line in the sand,” where – if broken – the door would open for the Index to post lower lows. In the event of such bearish price action, June lows around 24,595 could mark a secondary area of significant technical support. While the market awaits the momentous central bank meetings, price action may bleed lower or melt higher according to the latest read on the central bank’s leanings and the market’s outlook. With that in mind, retail traders remain overwhelmingly net-short the Dow Jones Industrial Average.
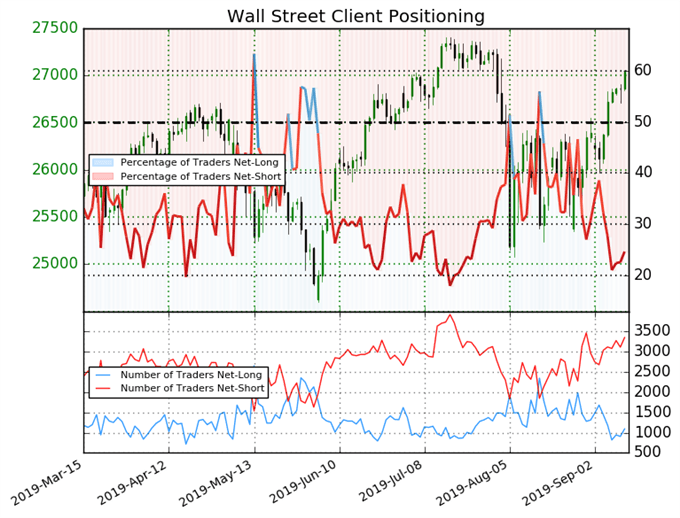
Retail trader data shows 24.6% of traders are net-long with the ratio of traders short to long at 3.06 to 1. In fact, traders have remained net-short since August 15 when the Dow Jones traded near 25918.0; price has moved 4.3% higher since then. The number of traders net-long is 7.1% lower than Tuesday and 33.7% lower from last week, while the number of traders net-short is 4.2% higher than Tuesday and 10.0% higher from last week.
We typically take a contrarian view to crowd sentiment, and the fact traders are net-short suggests the Dow Jones may continue to melt higher into the Fed meeting next Wednesday. Traders are further net-short than Tuesday and last week, and the combination of current sentiment and recent changes gives us a stronger DJIA-bullish contrarian trading bias.
--Written by Peter Hanks, Junior Analyst for DailyFX.com
Contact and follow Peter on Twitter @PeterHanksFX
Read more: Dow Jones, Nasdaq 100, DAX 30, FTSE 100 Forecasts for the Week


