


U.S. Indices Technical Outlook:
- S&P 500 ready to hit the 200-day and worse
- Dow Jones about to lose the 200-day
- Nasdaq 100 December trend-line failing
See how the quarterly forecast has played out what it could mean for the big-picture – Q3 Equity Markets Forecast.
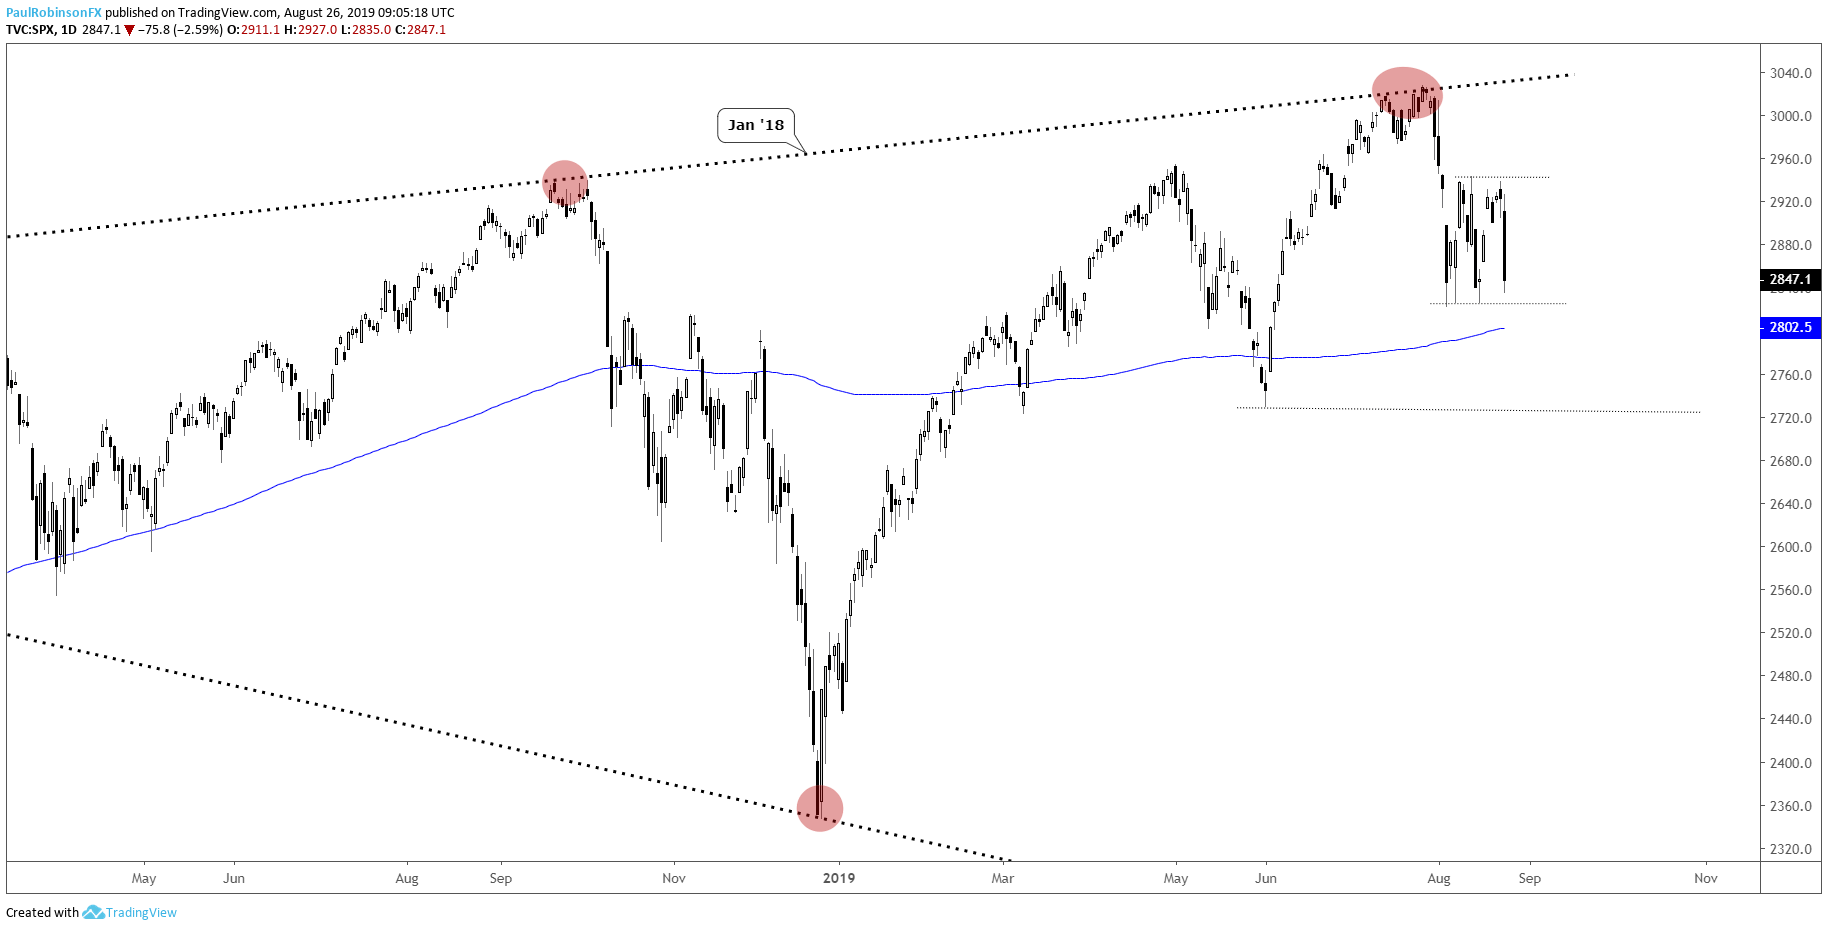
S&P 500 ready to hit the 200-day and worse
The early month decline off the high in the S&P 500 was met with some buying, but has not been sustainable and suggestive of another wave lower in the works. The range is set up to break below 2914 (cash price) to the 200-day just above 2800.
The environment has gotten volatile around the 200-day before, and that indeed looks to be the case here as it comes into focus again. Looking lower beyond the long-term average is June low around the 2750-mark.
The near-term could present a few twists and turns with volatility expected to remain elevated. Looking out longer-term things could worsen quite a bit for the market as topping formations across the indices become increasingly more visible.
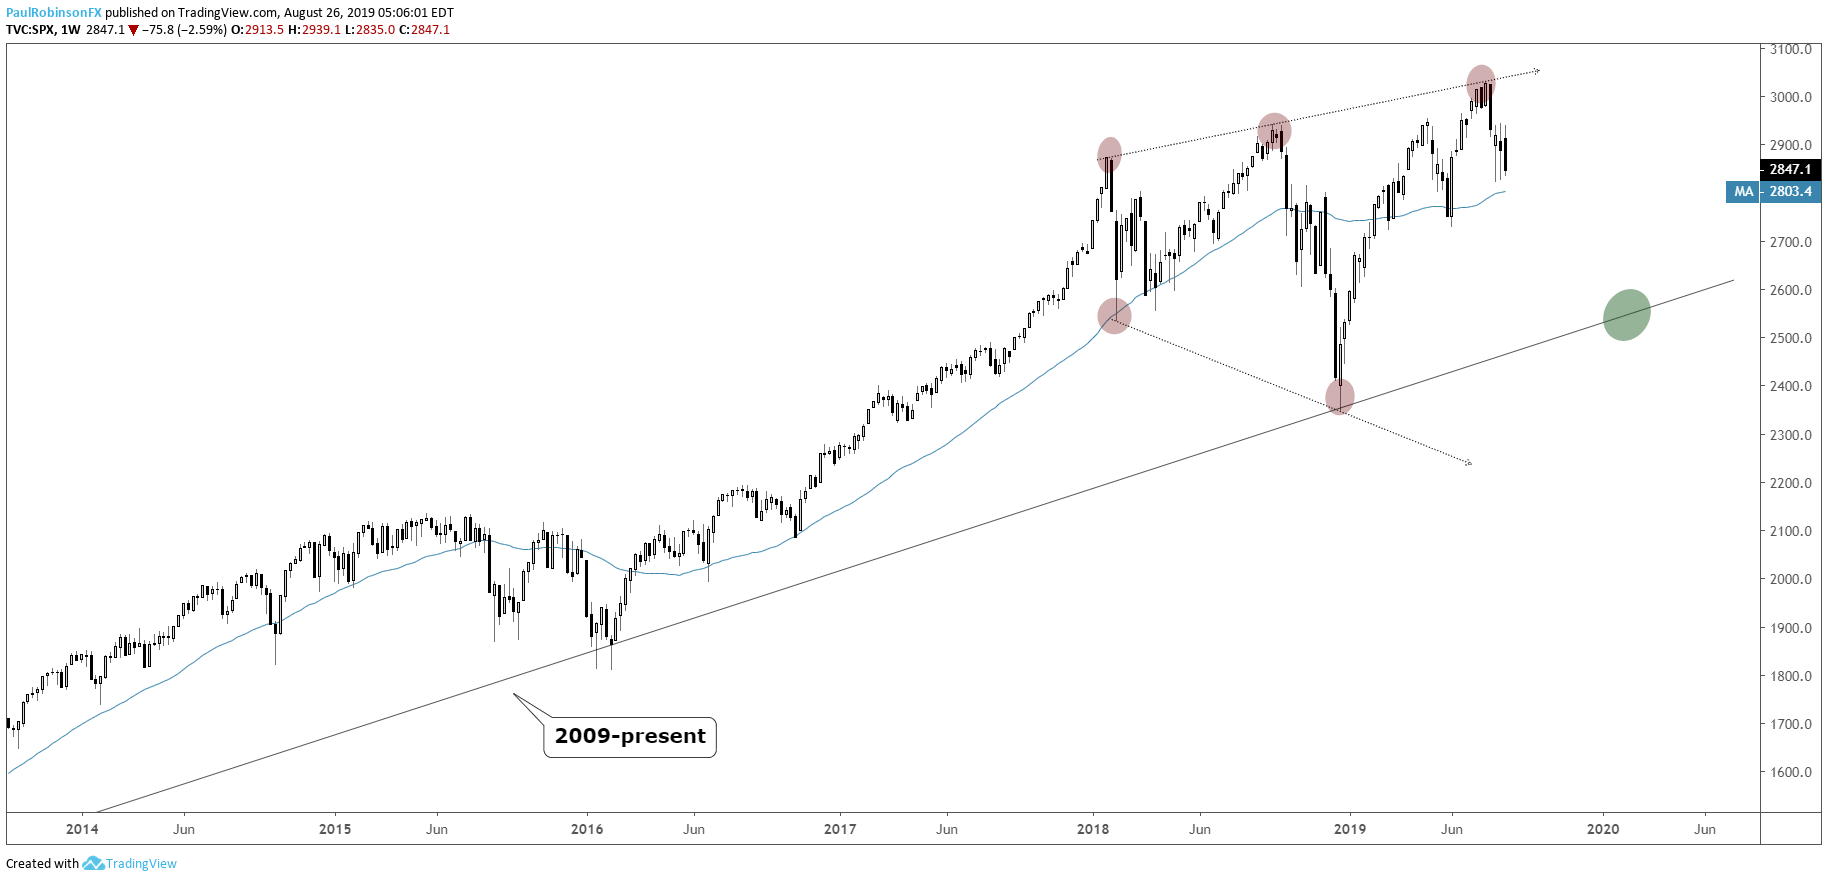
The Reverse Symmetrical Triangle (RST) dating back to January 2018 paints a potentially dire situation for the market as technical topping formations for long durations can lead to nasty declines if triggered. Just to get to the bottom of the formation would require a decline to around 2350, and a full trigger of the bottom of the pattern could spell another 20%+ from that point.
For now, running with a bearish bias even if the market doesn’t immediately fall apart, ideally staying below the top of the recent range at 2943. Big-picture forces could soon strengthen this bias for some time to come as the latter part of the year arrives.
Check out the IG Client Sentiment page to see how retail traders are positioned and what it could potentially mean for various currencies and markets moving forward.
S&P 500 Daily Chart (congestion pattern)
S&P 500 Weekly Chart (‘RST’)
Dow Jones about to lose the 200-day
The Dow is putting in a rectangle consolidation pattern right on the 200-day, looking as though that might not last much longer. The futures dropped below in overnight trade but are still holding on. A decline below the range-low at 25339 could have the June low in play quick-like at 24680. The Dow, like the S&P, has the same big-picture RST. It will certainly be interesting to see if the market can continue to develop this situation into something much larger…
Dow Jones Daily Chart (ranging on 200-day)

Dow Jones Chart by Tradingview
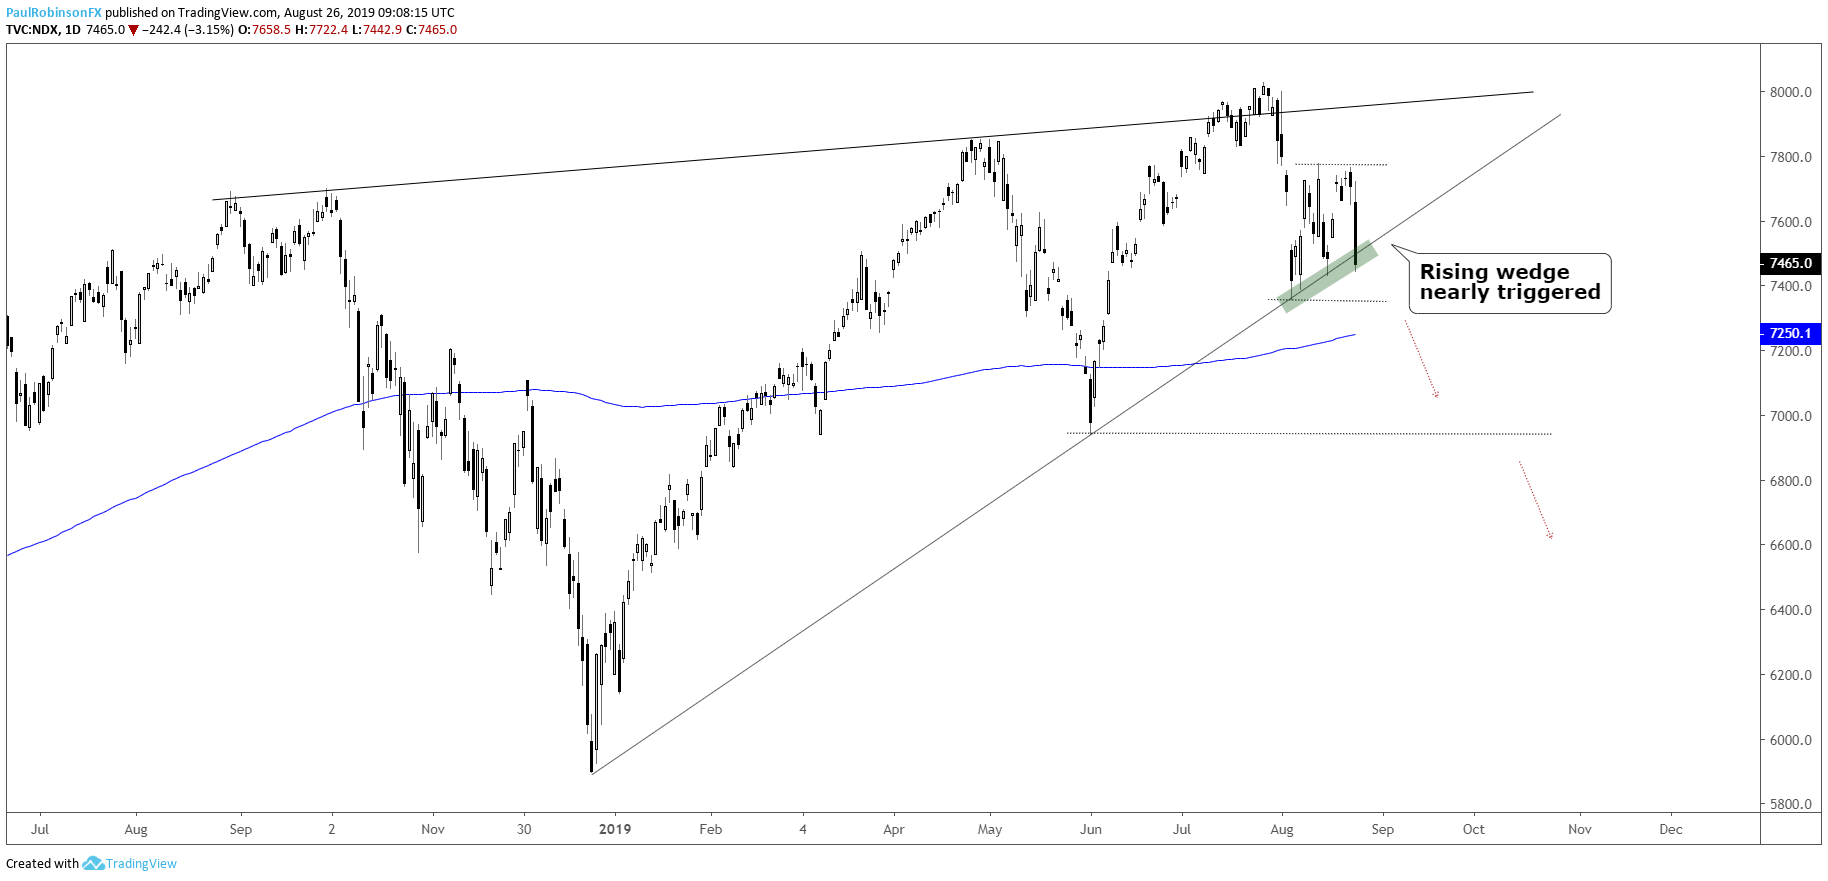
Nasdaq 100 December trend-line failing
The Nasdaq 100 has a rising wedge that has been building since about a year-ago. The December trend-line is part of the pattern and has acted as support recently, but with Friday’s drop that is headed for a failure to maintain a bid. A little further down the pattern will have officially triggered. This would likely make the 200-day nothing more than a speedbump on the way to the June low of 6936 and worse.
Nasdaq 100 Daily Chart (Dec t-line about to break, trigger wedge)
Nasdaq 100 Chart by Tradingview
To learn more about U.S. indices, check out “The Difference between Dow, Nasdaq, and S&P 500: Major Facts & Opportunities.” You can join me every Wednesday at 10 GMT for live analysis on equity indices and commodities, and for the remaining roster of live events, check out the webinar calendar.
Tools for Forex & CFD Traders
Whether you are a beginning or experienced trader, DailyFX has several resources available to help you; indicator for tracking trader sentiment, quarterly trading forecasts, analytical and educational webinars held daily, trading guides to help you improve trading performance, and one specifically for those who are new to forex.
---Written by Paul Robinson, Market Analyst
You can follow Paul on Twitter at @PaulRobinsonFX


