


Dow Jones/S&P 500 Outlook:
See how the quarterly forecast has played out so far and what it could mean to end June in the Q2 Equity Markets Forecast.
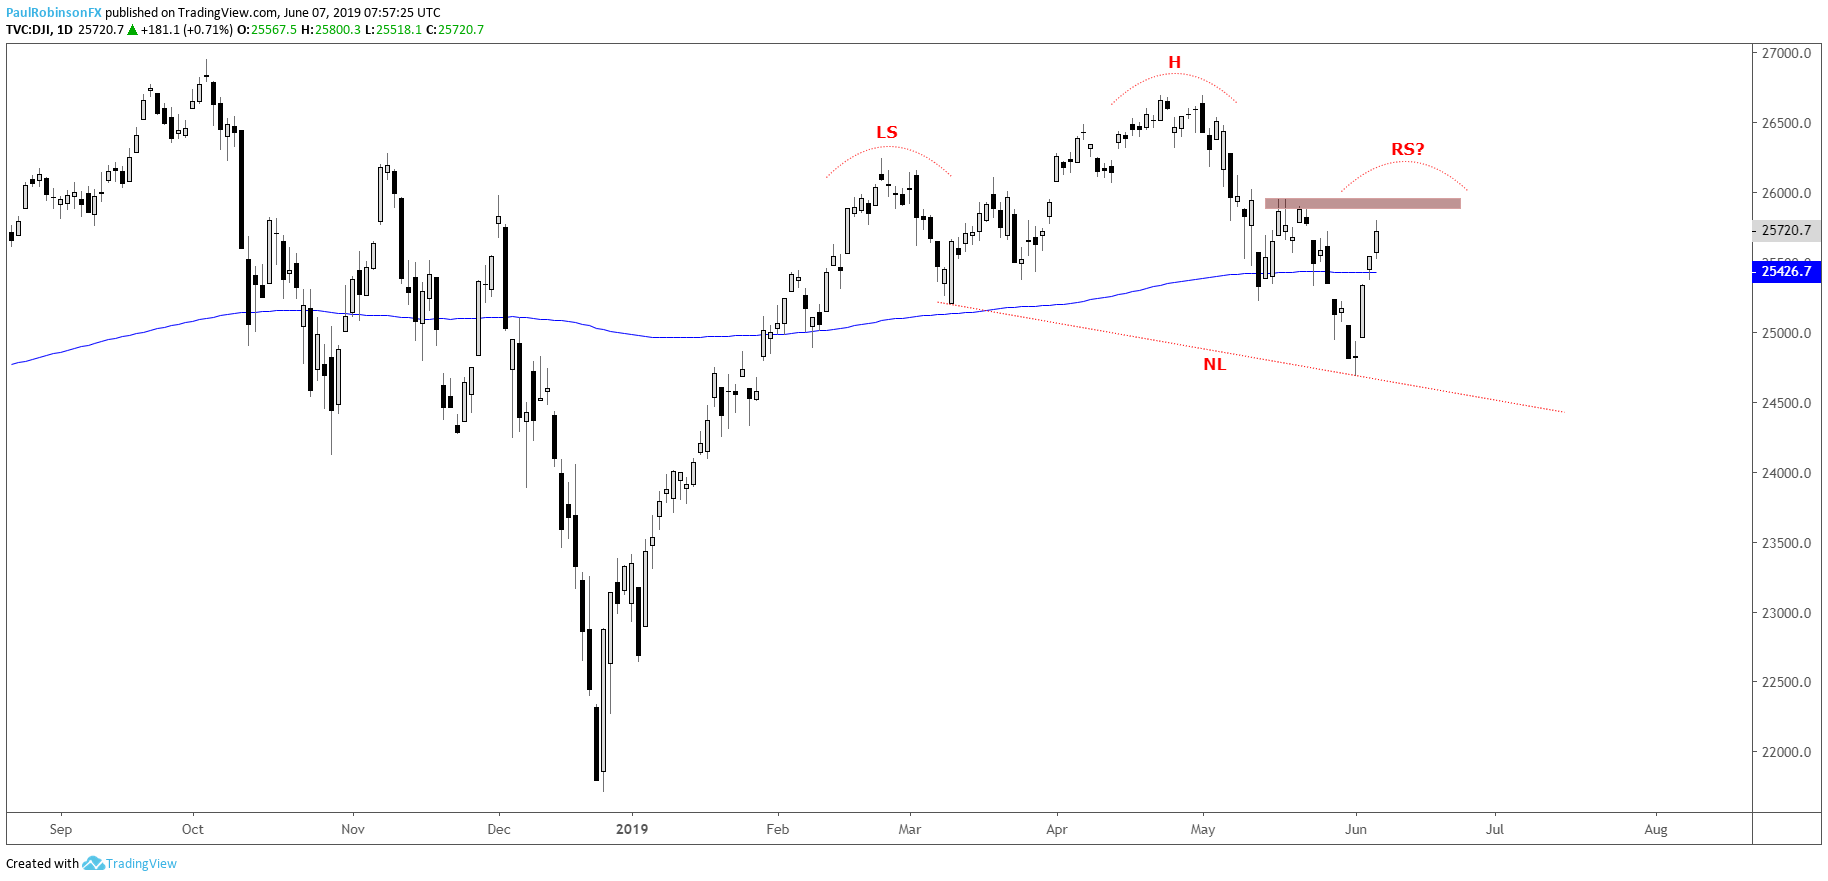
Dow Jones has head-and-shoulders potential
The Dow Jones has seen some nice lift these past few sessions, bolstering it back above the 200-day MA. In the process of rallying it could be carving out the right shoulder of a head-and-shoulders (H&S) pattern. This is only a scenario at this time as the right shoulder still needs to form and then a break of the neckline has to develop for the scenario to be validated.
It’s a scenario worth monitoring closely at this juncture with only a limited amount of time needed before a trigger-event could happen (drop below the neckline). A spot to watch for as resistance in the near-term is the high of the last minor bounce in the 25880/957-area. A turn down from around there would make for a fairly symmetrical-looking pattern.
Again, the neckline needs to be broken so there is work yet to be done. If the market continues to work its way higher without a meaningful turn down, then continuing to run with a bullish bias may be the most suitable approach. A failure to turn down from the aforementioned resistance zone, or only a shallow pullback, may indeed offer a long set-up.
At this time given where we are in the bounce off the lows, risk/reward from either side doesn’t hold much appeal.
Check out the IG Client Sentiment page to see how retail traders are positioned and what it could potentially mean for various currencies and markets moving forward.
Dow Jones Daily Chart (H&S potential)
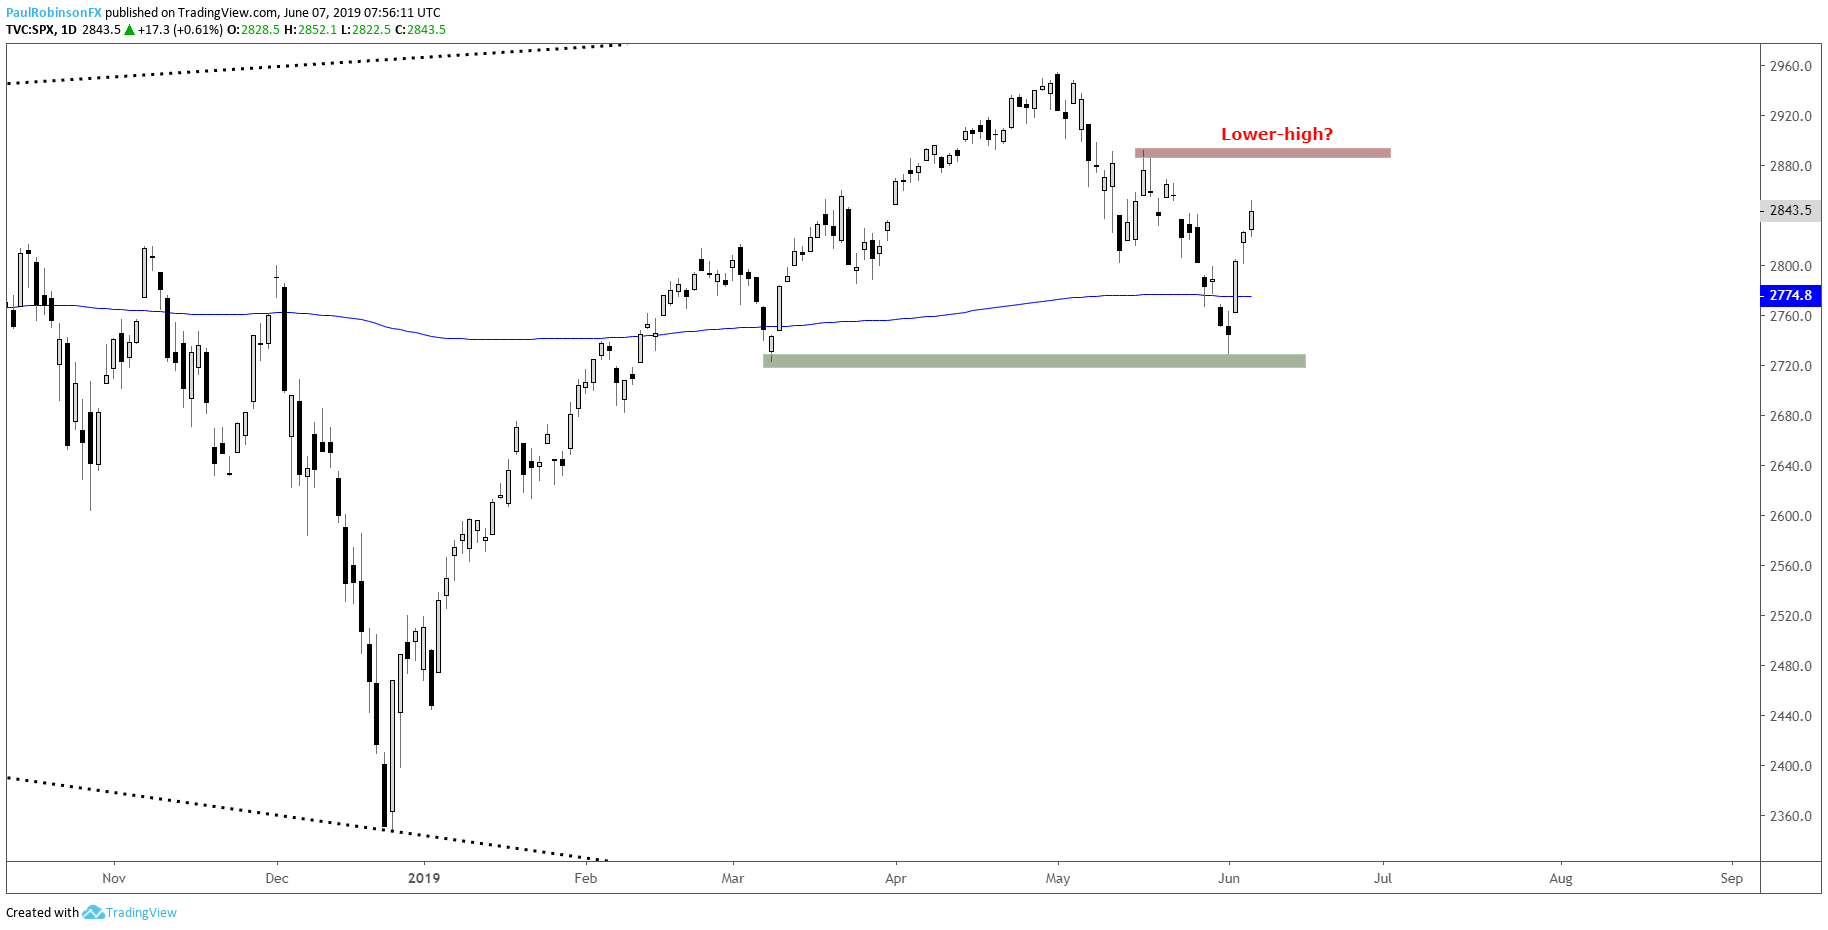
S&P 500 rallying but may soon fail
The S&P 500 doesn’t hold much clarity at this juncture, it’s not sporting a look that gives either side an edge. If the Dow has the cleaner pattern and indeed does come to fully develop the H&S pattern, then the S&P is headed for a lower-high of significance.
If not, then a consolidation pattern in the near-term may at some point offer a set-up for a long trade to the top-side. Watch how price reacts should it reach up to the 2876/92 zone.
S&P 500 Daily Chart (Lower-high to develop?)
To learn more about U.S. indices, check out “The Difference between Dow, Nasdaq, and S&P 500: Major Facts & Opportunities.” You can join me every Wednesday at 10 GMT for live analysis on equity indices and commodities, and for the remaining roster of live events, check out the webinar calendar.
Tools for Forex & CFD Traders
Whether you are a beginning or experienced trader, DailyFX has several resources available to help you; indicator for tracking trader sentiment, quarterly trading forecasts, analytical and educational webinars held daily, trading guides to help you improve trading performance, and one specifically for those who are new to forex.
---Written by Paul Robinson, Market Analyst
You can follow Paul on Twitter at @PaulRobinsonFX


