


S&P 500/Dow Jones/Nasdaq 100 Technical Highlights:
- S&P 500 nearing 2800-area, several swing-highs from last year
- Dow Jones 26k-ish stands between it and record highs
- Nasdaq 100 trading around resistance already
Check out the forecasts for Global Stock Indices and other markets on the Trading Guides page.
S&P 500 nearing 2800-area, several swing-highs from last year
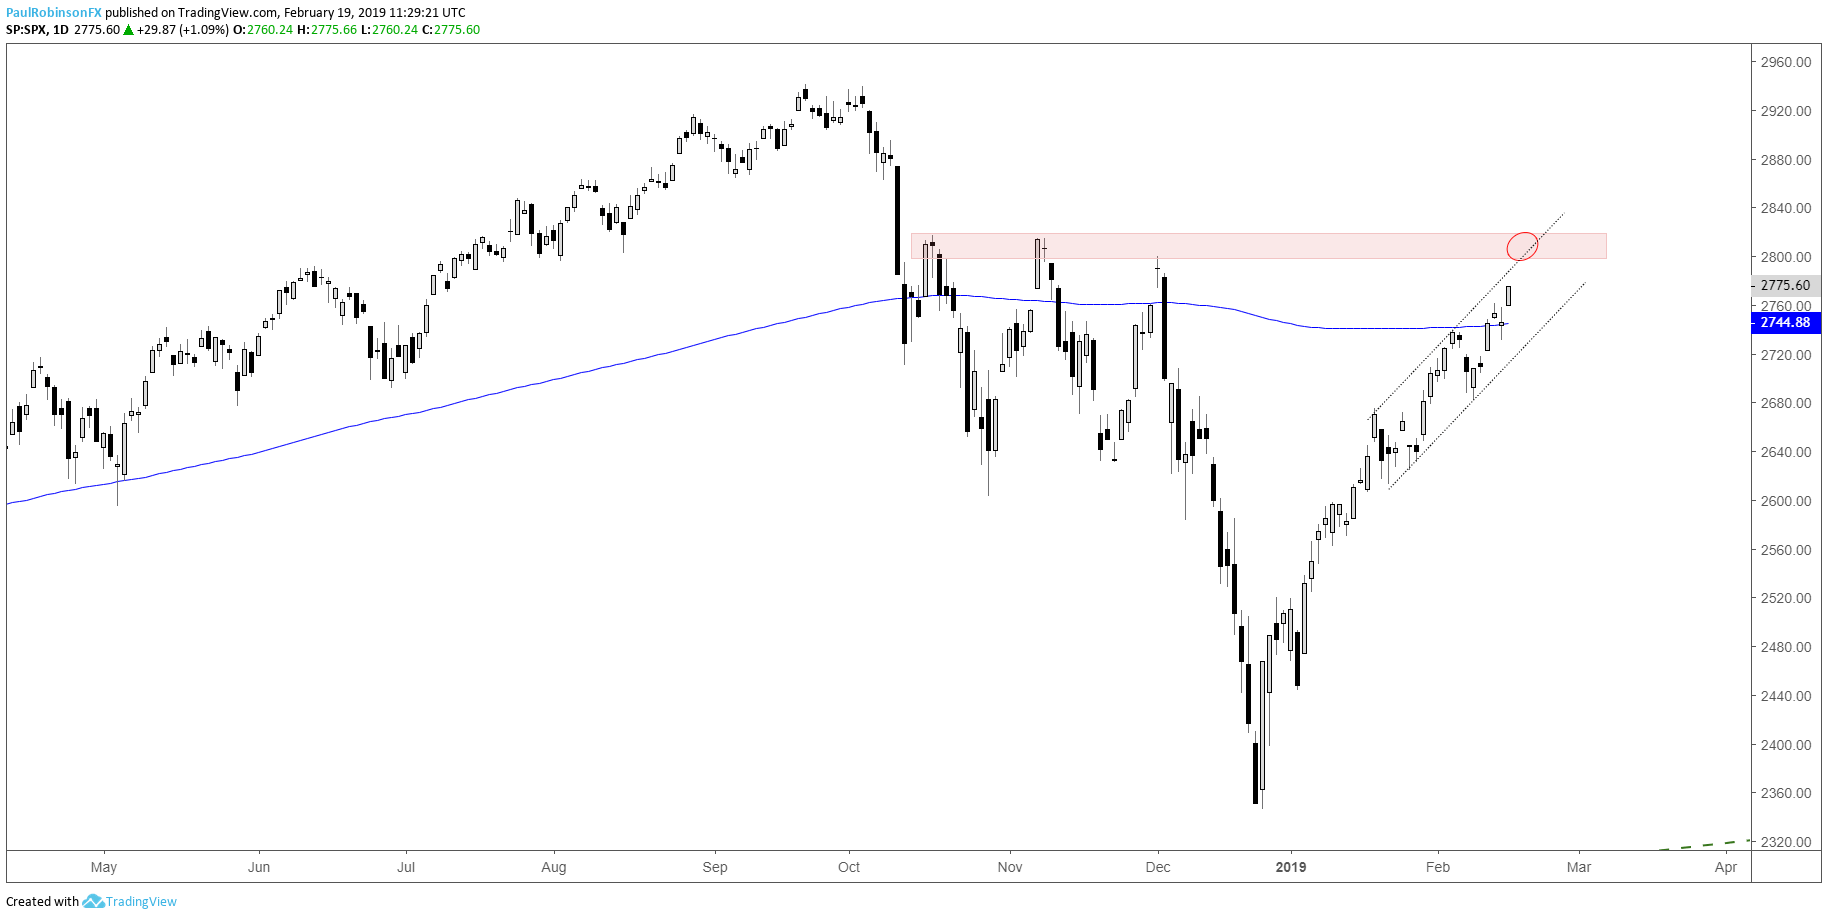
The S&P 500 is continuing to show impressive strength since its v-bottom began the day after Christmas, with it having a few points along the way where it could have been stopped in its tracks. But it wasn’t, and this has levels prior to the December swoon in view. The area surrounding 2800 is a big one.
From 2800 up to 2817 there were three peaks created from failed rallies, a logical area, with the rally having come this far, to look for stocks to weaken from. Watching price action will be key, as always, but especially around the levels just ahead.
While resistance looks likely to get tested soon, the upward channel structure over the past month will keep stocks pointed higher for as long as it holds. If the S&P is rejected off resistance, to further bolster the notion of a sizable retracement we’ll need to see the underside parallel undermined.
For now, the top-side must be respected, but the time for material weakness may be nearing…
Stocks are rallying, but will it last in the long-term? Find out where our analysts see stocks headed in the Global Equities Forecast.
S&P 500 Daily Chart (2800/817 big spot)
Dow Jones 26k-ish stands between it and record highs
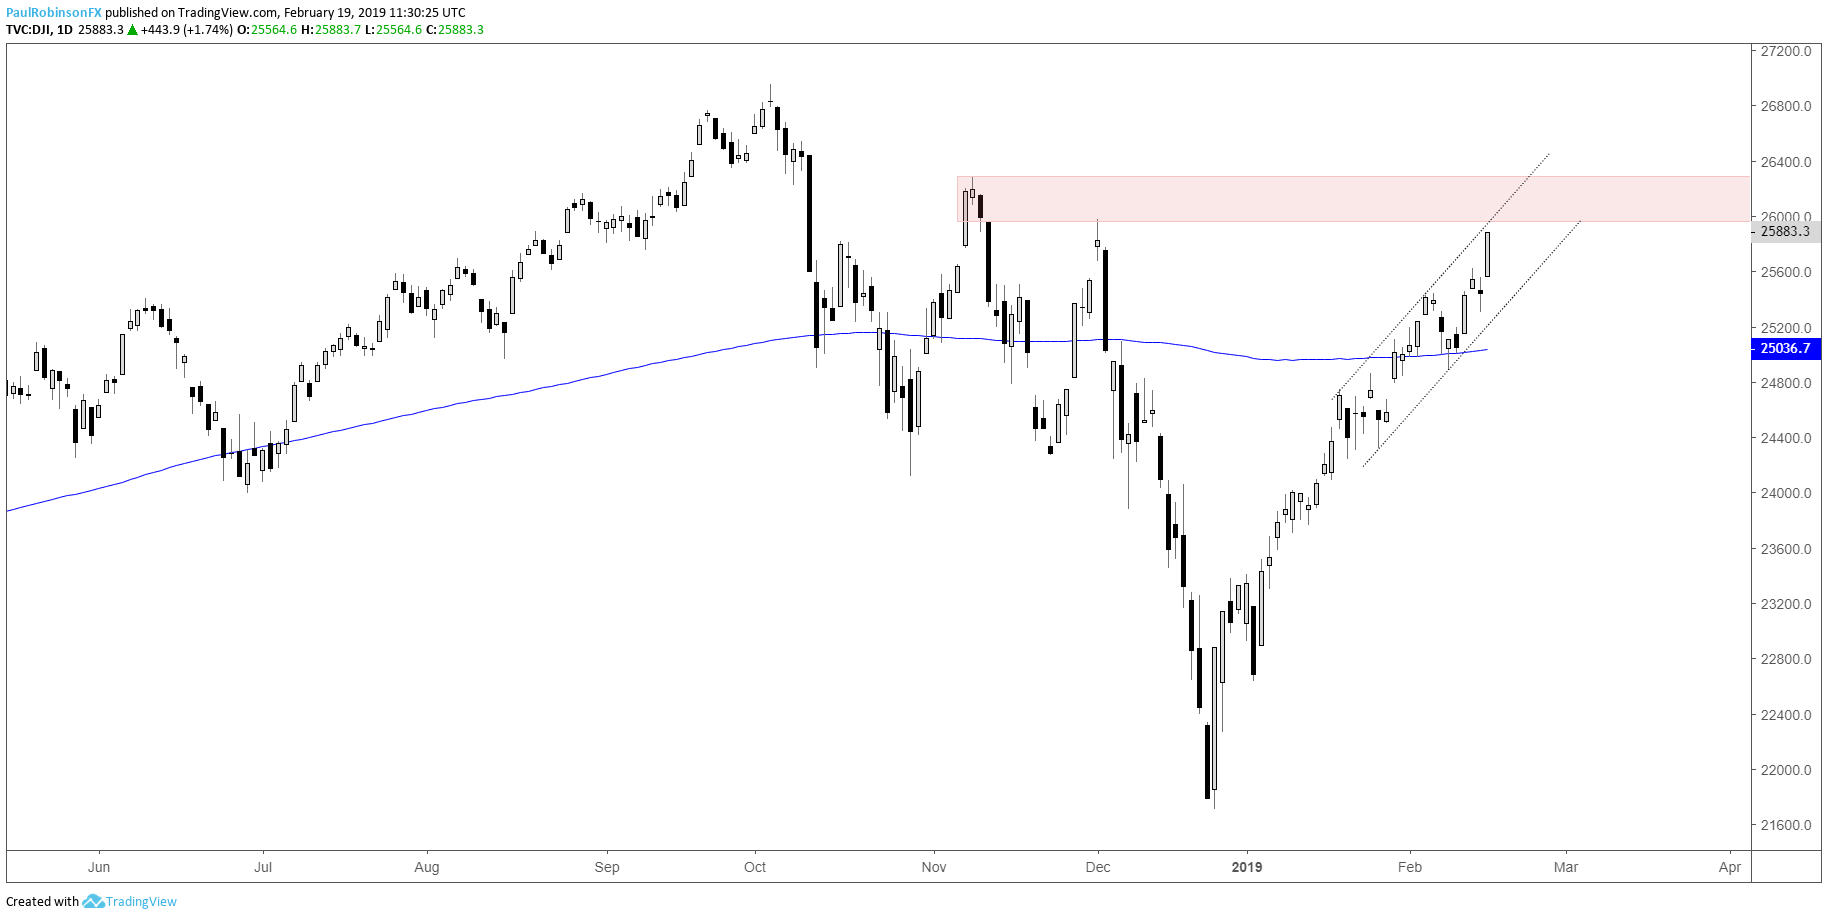
The Dow is nearing the 26k-area, a spot which is basically the equivalent of what 2800 is to the S&P 500. The zone runs up to near 26300. The focus is primarily on the S&P right now as it is the broader index, but depending on how price action plays out, the Dow may be the better index to short at some point if it shows relative weakness to the broader market.
Dow Daily Chart (26k-ish stands in the way)
Nasdaq 100 trading around resistance already
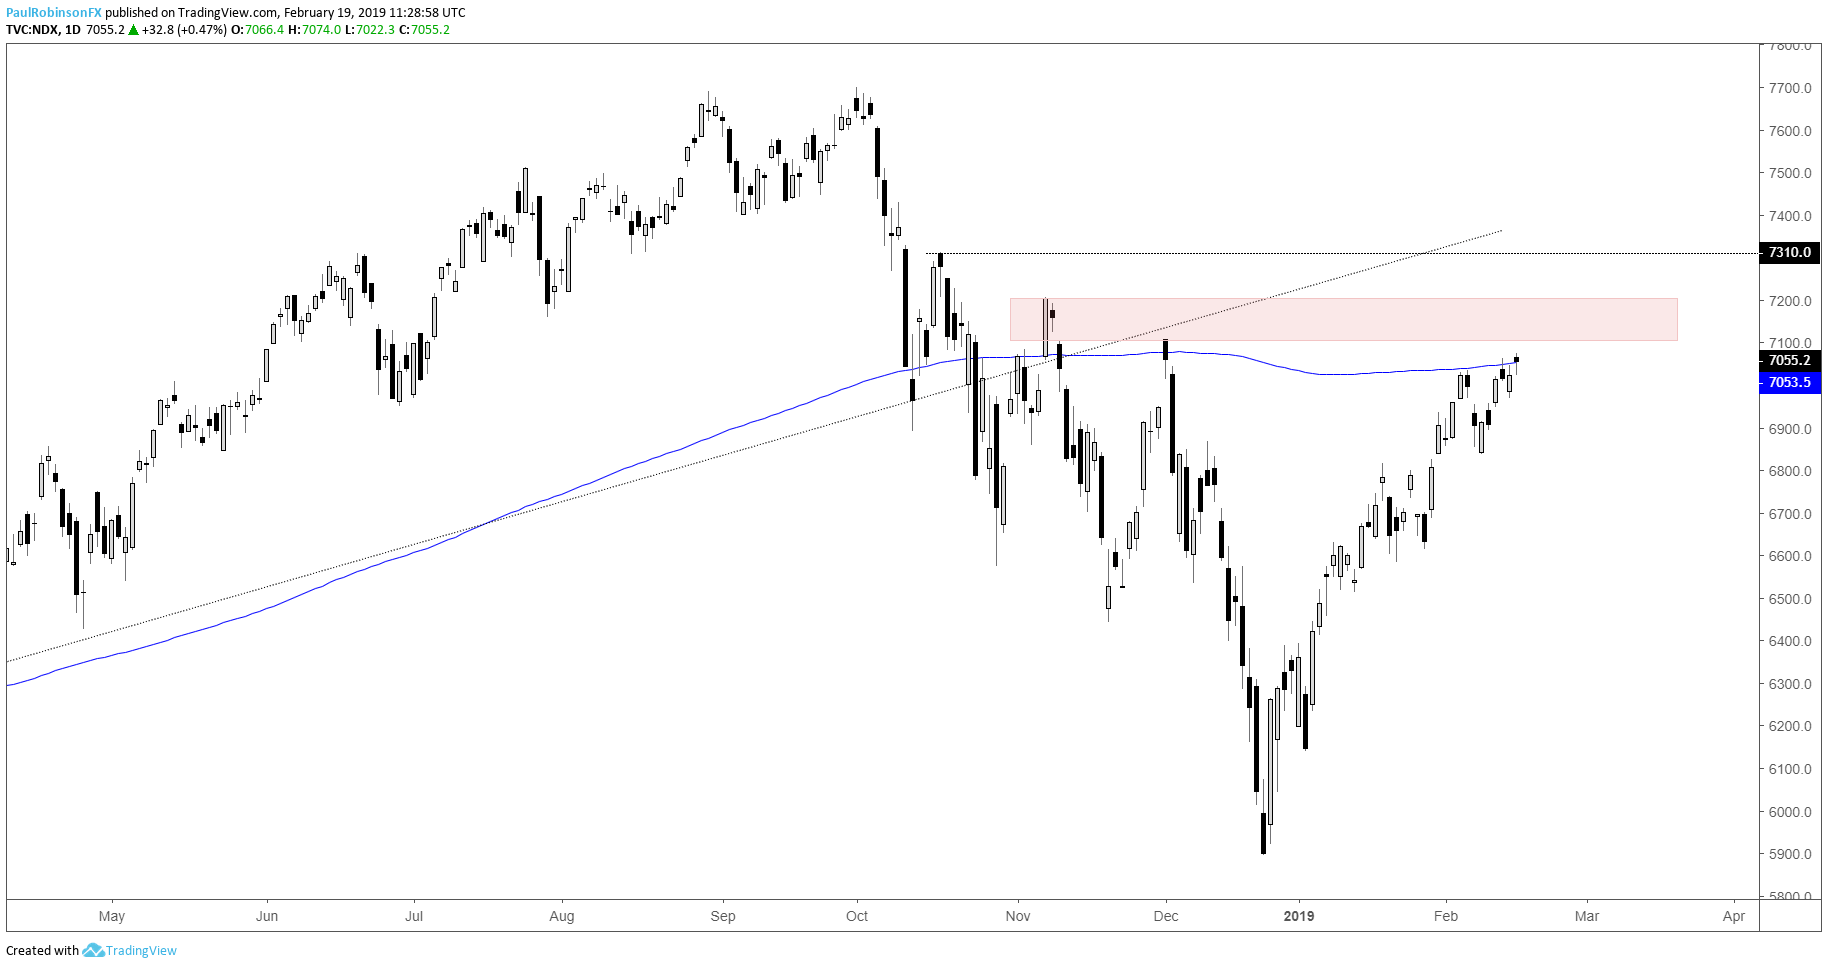
The Nasdaq 100 continues to lag behind, which is something to continue monitor given it was the bull-market leader with its leading group of stocks – FAANG – dominating price action and sentiment. The NDX is trading around the 200-day and near late-year swing highs equivalent to the ones discussed with regard to the S&P 500 and Dow. So far, relative weakness is making the 100 the preferred fade if the S&P finds material selling off resistance surrounding 2800/17.
Nasdaq 100 Daily Chart (trading around resistance)
To learn more about U.S. indices, check out “The Difference between Dow, Nasdaq, and S&P 500: Major Facts & Opportunities.” You can join me every Wednesday at 10 GMT for live analysis on equity indices and commodities, and for the remaining roster of live events, check out the webinar calendar.
Tools for Forex & CFD Traders
Whether you are a beginning or experienced trader, DailyFX has several resources available to help you; indicator for tracking trader sentiment, quarterly trading forecasts, analytical and educational webinars held daily, trading guides to help you improve trading performance, and one specifically for those who are new to forex.
---Written by Paul Robinson, Market Analyst
You can follow Paul on Twitter at @PaulRobinsonFX


