


S&P 500/Dow Jones/Nasdaq 100 Technical Highlights:
- S&P 500 trading around trend-line
- Dow Jones has confluent resistance just ahead
- Nasdaq 100 lagging, has lesser resistance
Q1 Forecasts are out. Check out the Trading Guides page for these and other guides to help you get off to a good start to 2019.
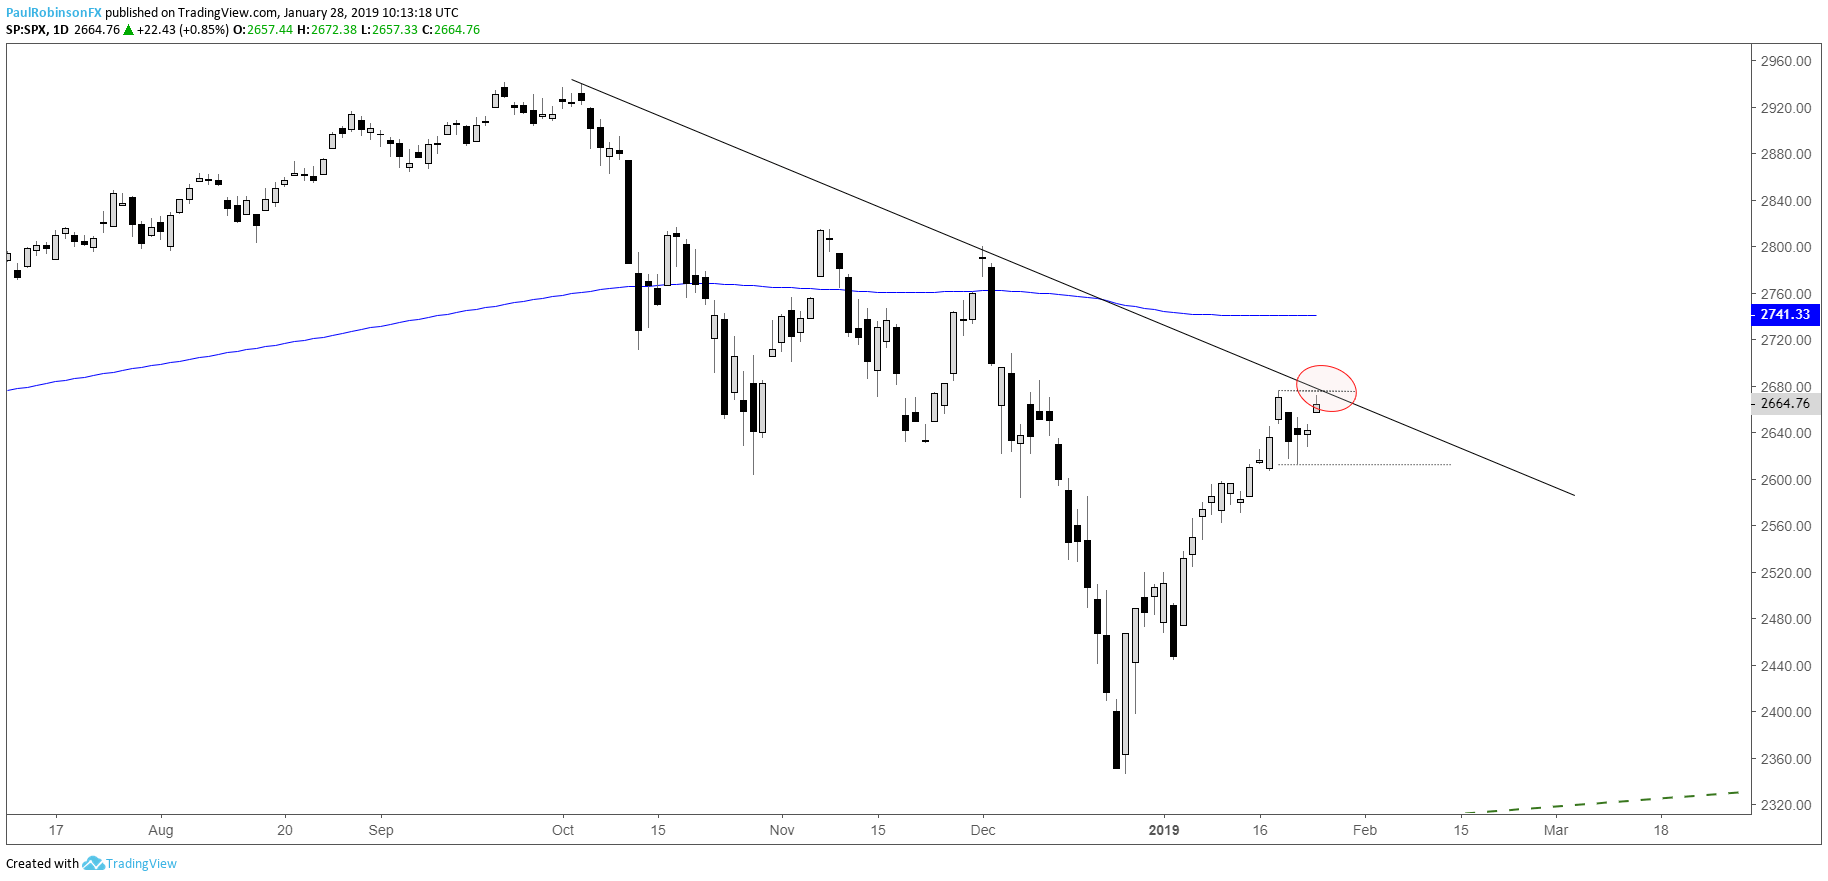
S&P 500 trading around trend-line
The rally off the low in the S&P 500 has been fierce, erasing most of the damage from December. Given the extended state the market is in with its limited set-backs in recent weeks, a pullback is due. If one is to develop then now is as a good time as any to start looking for price action to begin showing signs of a reversal.
The trend-line off the record high is currently being tested and should we see the market turn down from here then would-be shorts may look to play for near-term weakness. A decline below the Jan 23 low at 2612 will help further validate the notion of a decline. If the market continues to push higher beyond the trend-line, there aren’t any significant levels to speak of until the 200-day MA.
With global stock market volatility high, see where our analysts see stocks headed in the Q1 Global Equities Forecast.
S&P 500 Daily Chart (t-line)
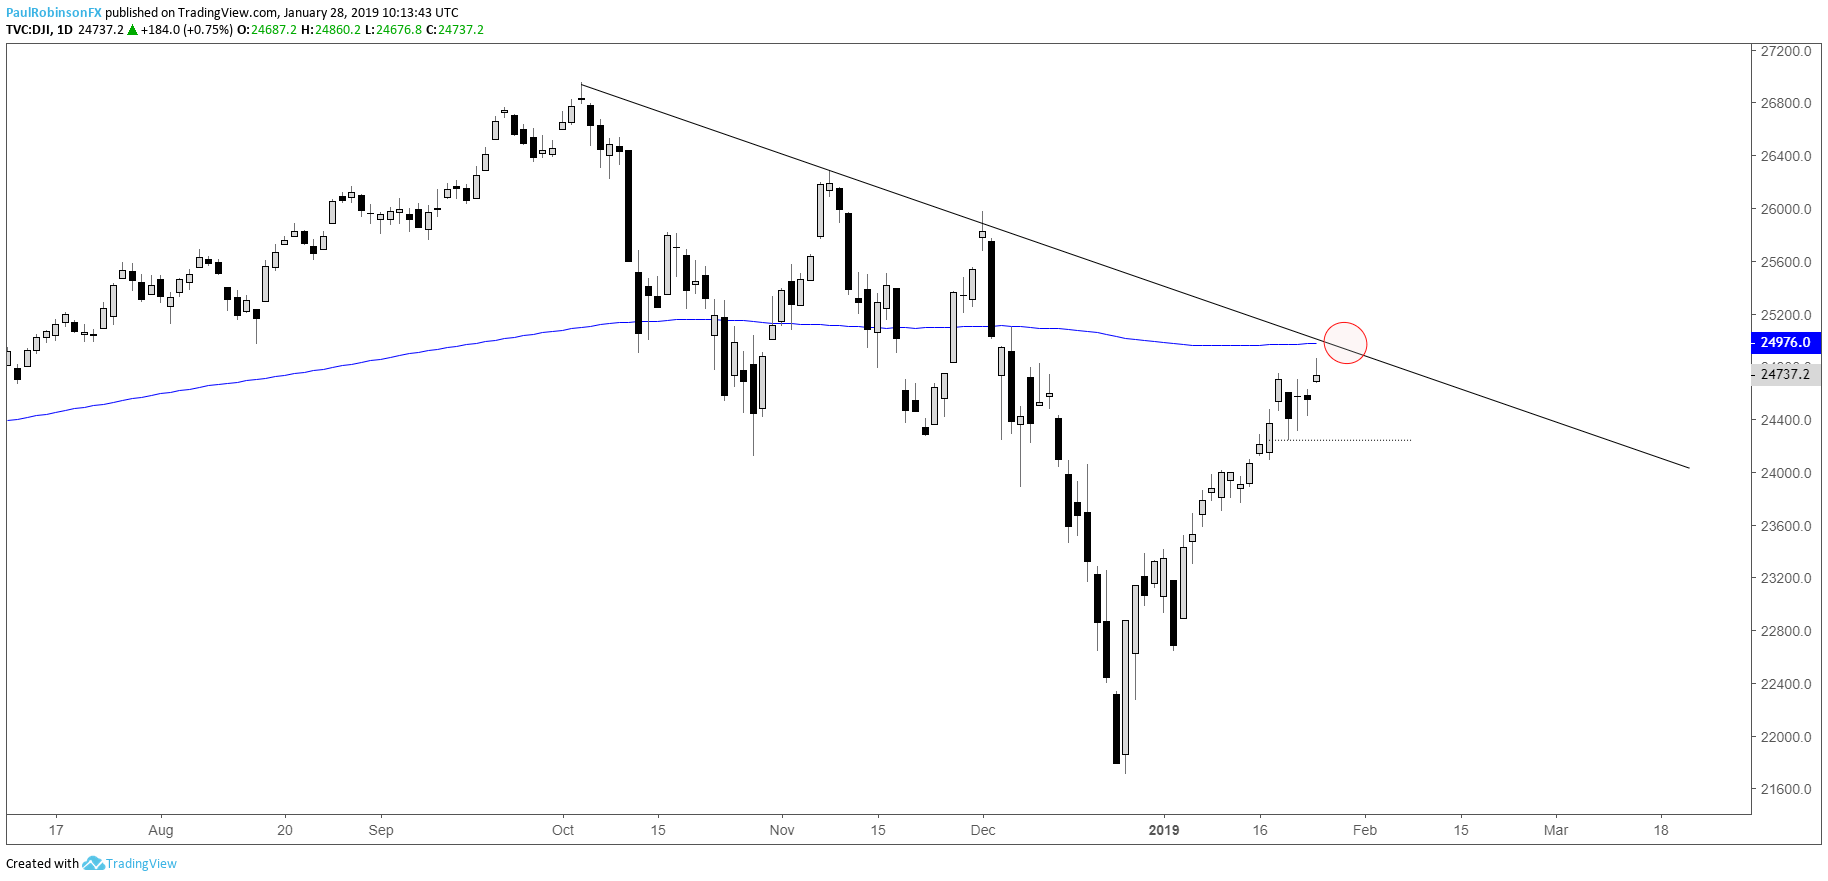
Dow Jones has confluent resistance just ahead
The Dow is staring down not only a trend-line from the record high but the 200-day MA. This confluence is seen as strong and likely to be problematic for the index moving forward. A bearish daily reversal bar will add conviction.
Dow Daily Chart (200-day/t-line)
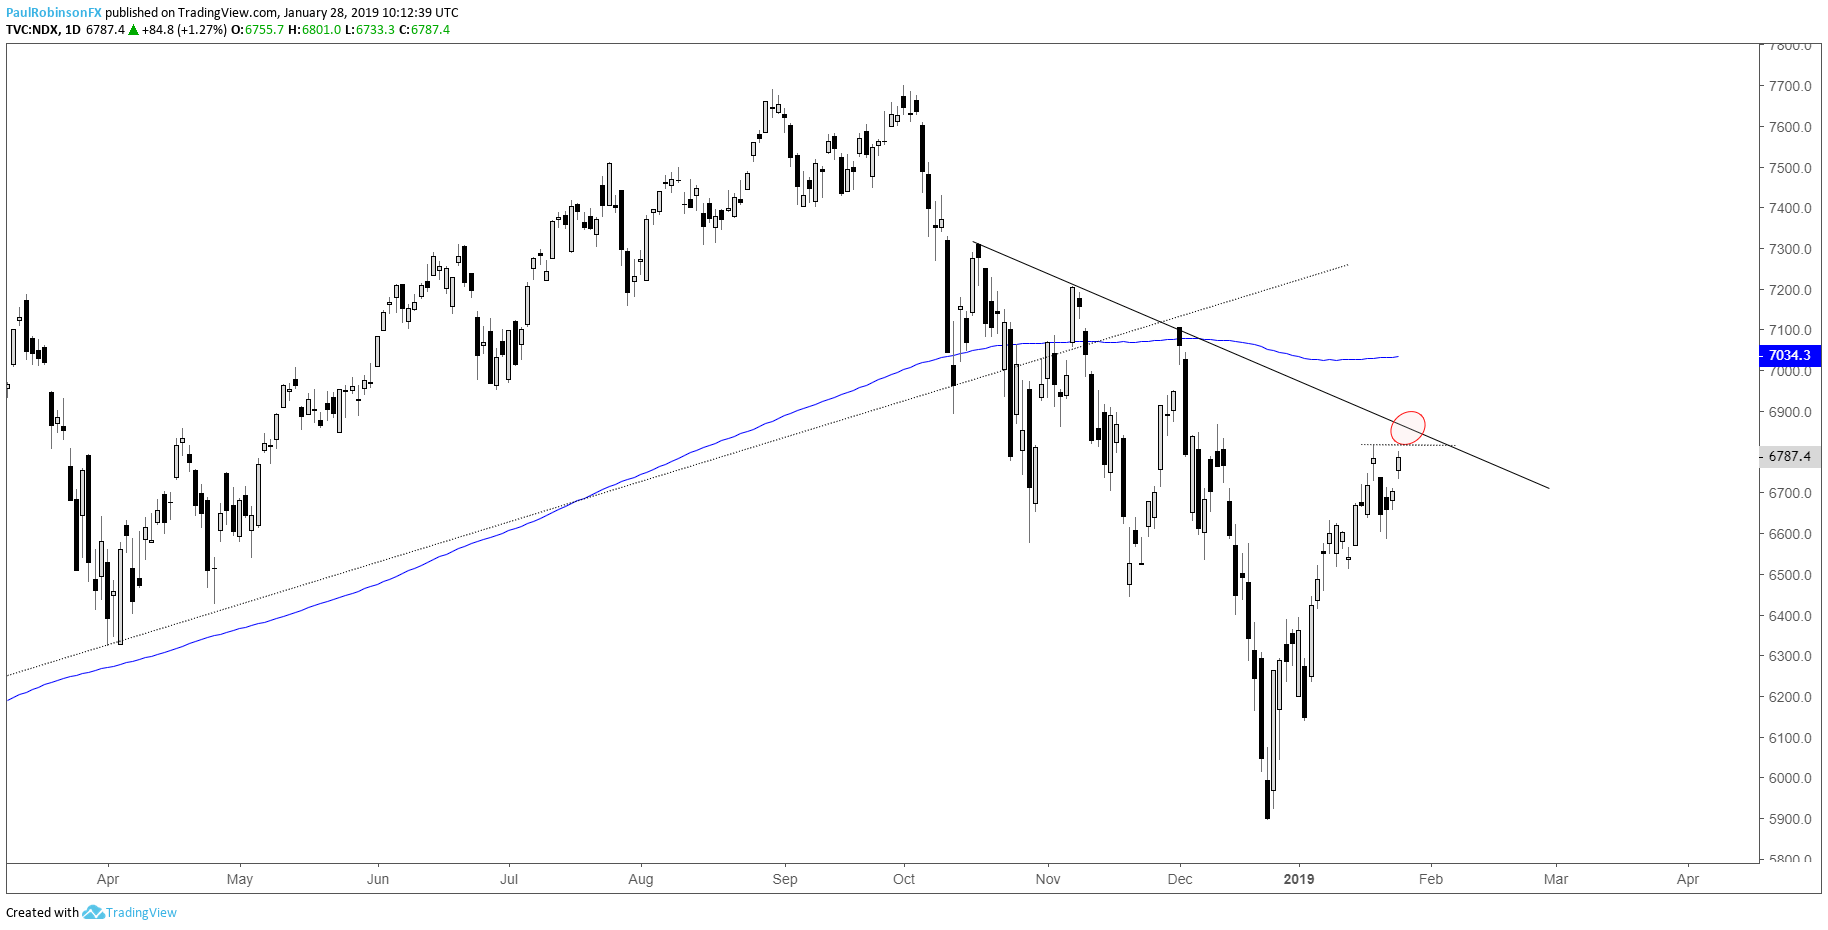
Nasdaq 100 lagging, has lesser resistance
The Nasdaq 100 remains a laggard, which may prove as a sign that it wants to trade lower at a faster pace than the other two major indices. Trend-line resistance from October may put a cap on it, but in any event when the market weakens as some point it will be worth taking note if sellers show up in larger numbers in the NDX.
Nasdaq 100 Daily Chart (t-line)
To learn more about U.S. indices, check out “The Difference between Dow, Nasdaq, and S&P 500: Major Facts & Opportunities.” You can join me every Wednesday at 10 GMT for live analysis on equity indices and commodities, and for the remaining roster of live events, check out the webinar calendar.
Tools for Forex & CFD Traders
Whether you are a beginning or experienced trader, DailyFX has several resources available to help you; indicator for tracking trader sentiment, quarterly trading forecasts, analytical and educational webinars held daily, trading guides to help you improve trading performance, and one specifically for those who are new to forex.
---Written by Paul Robinson, Market Analyst
You can follow Paul on Twitter at @PaulRobinsonFX


