


S&P 500/Dow Jones Technical Highlights:
- S&P 500 rallying into resistance, soon to undergo a test
- Dow clearing some resistance but still has more ahead
Fresh quarterly forecasts are out! Check out the Trading Guides page for these and other guides to help you get off to a good start to 2019.
S&P 500 rallying into resistance, soon to undergo a test
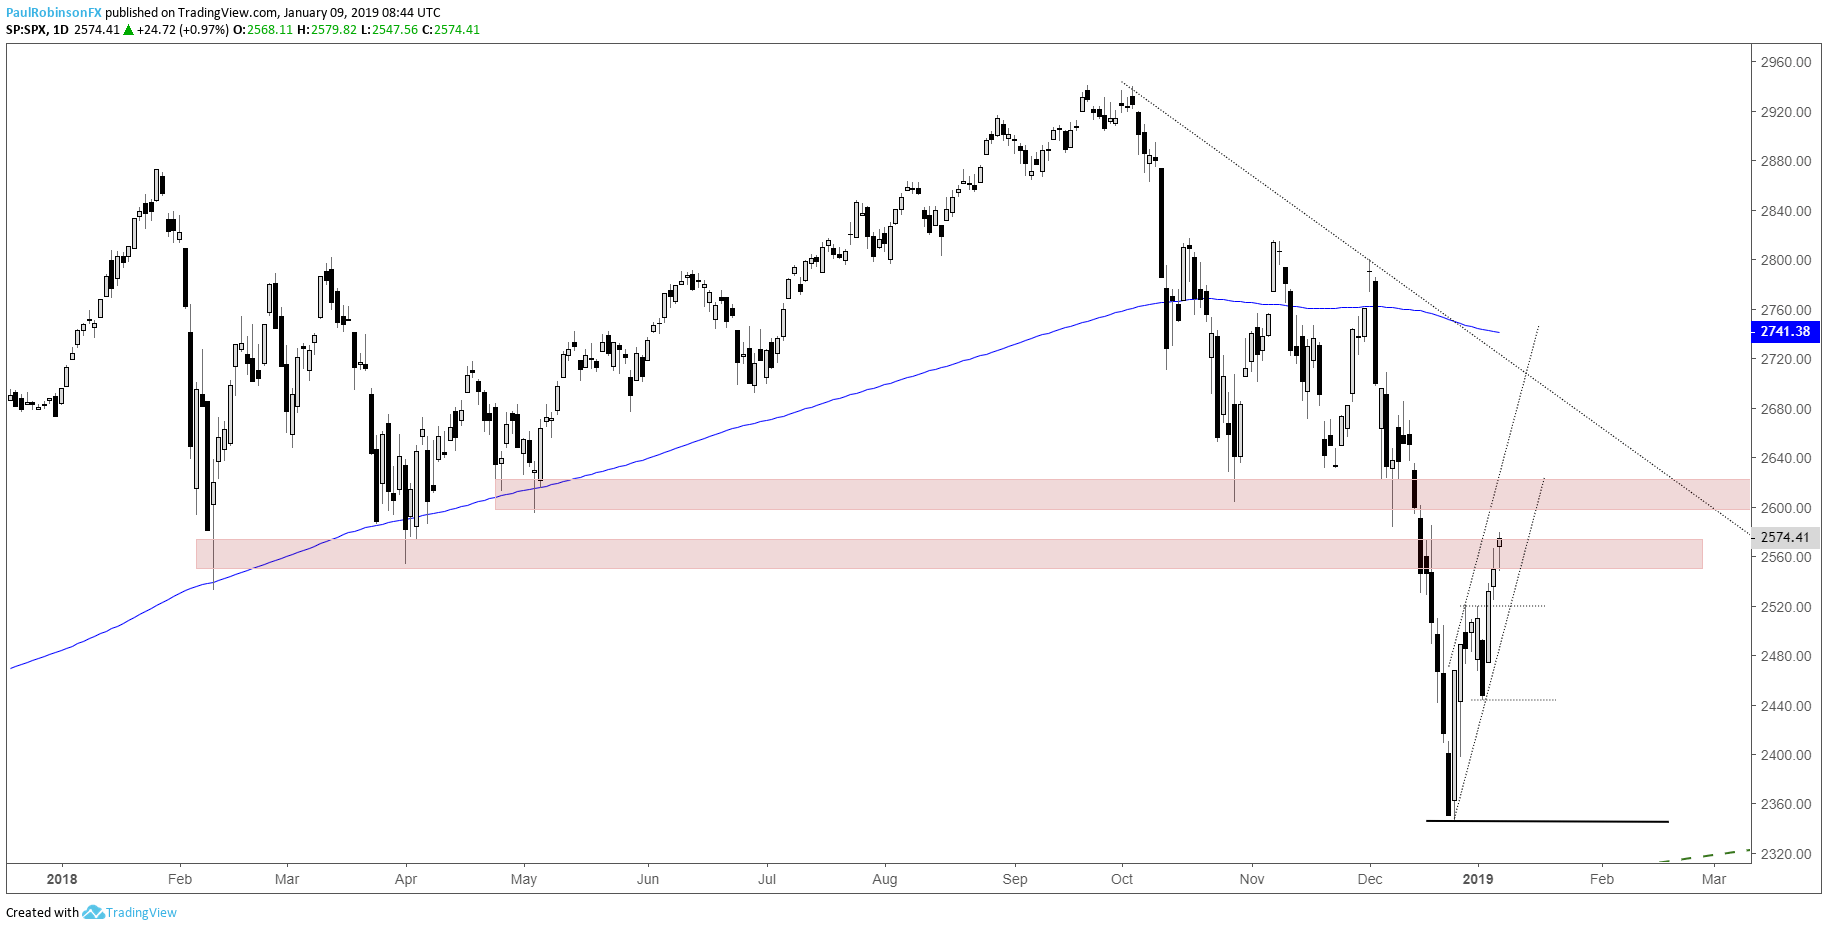
On Friday, I noted that the S&P 500 looked poised to continue pushing higher, but with resistance levels from current levels and not too far higher the bounce is likely to soon be put to the test. Buying at this juncture holdslittle appeal outside of intra-day quick-hitters.
With a turn down in momentum shorts look likely to gain the upper-hand in the short-term. Resistance levels add to the case, but typically coming out of a low, whether the low is to last for a while or not, testing of strength is the norm.
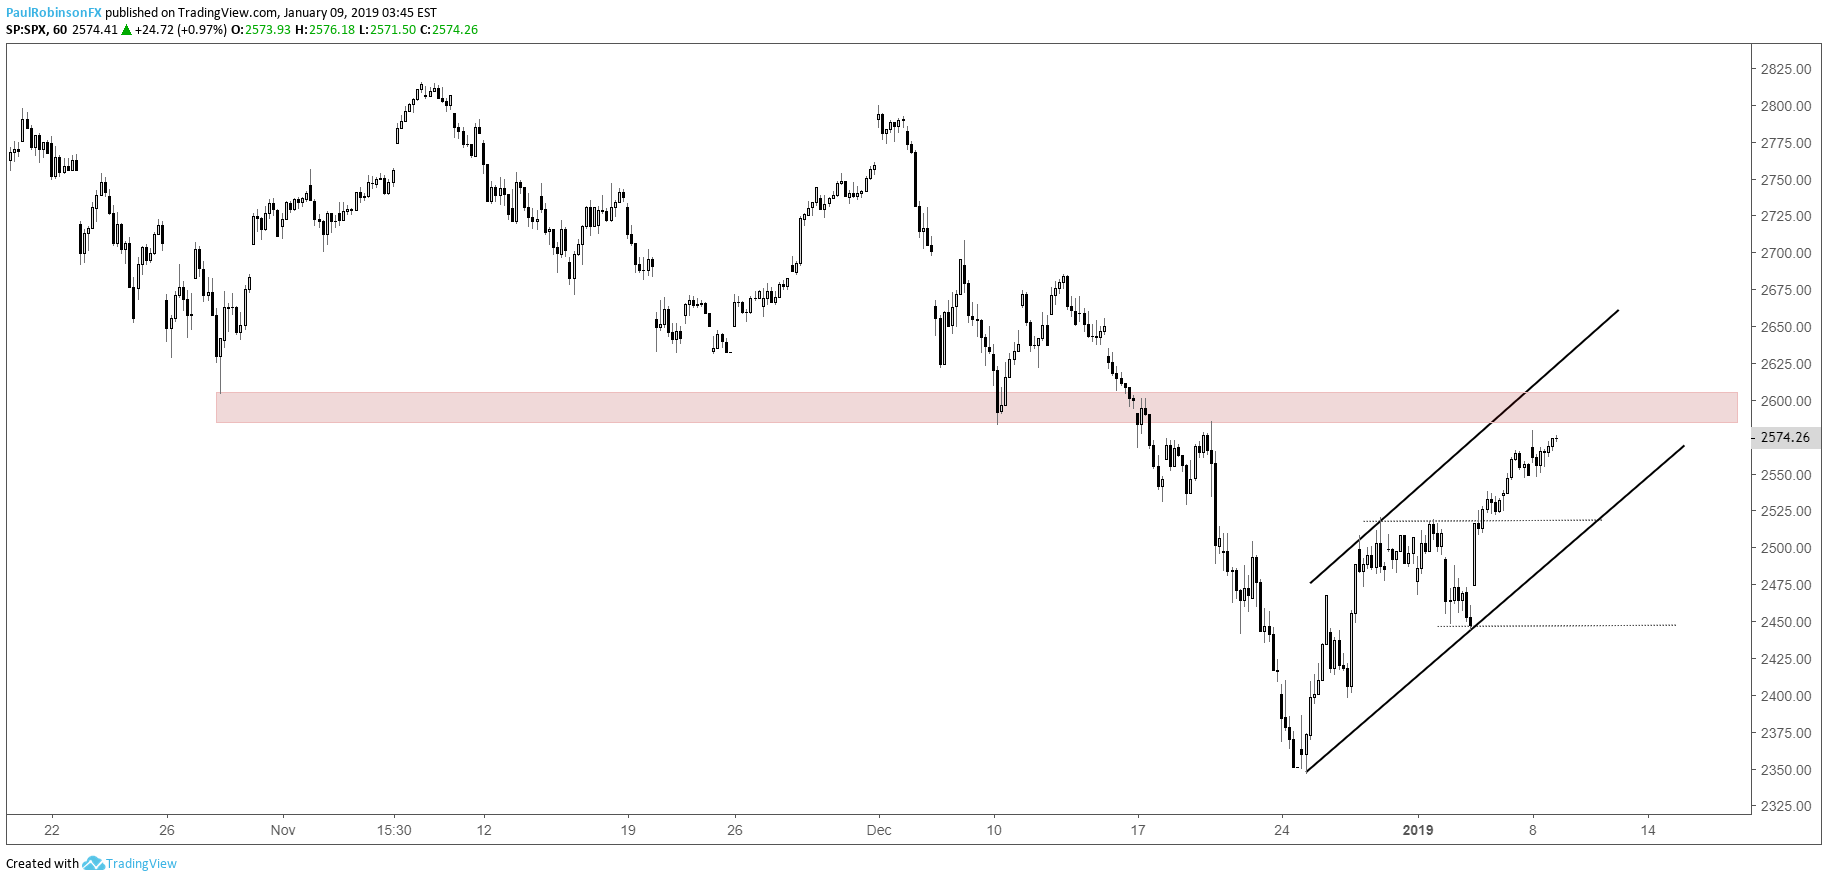
With that in mind, staying nimble and trading short-term volatility appears to be a prudent tactical approach for the time-being. Volatility has settled down a bit, but there will remain sufficiently large swings to take advantage of.
There is a developing channel on the hourly time-fame which should become increasingly useful for helping shape short-term maneuvers from both sides of the tape.
I am looking for the market to roll-over again at some point early this year and resume the kind of weakness seen in Q4, but this may take some more back-and-forth correcting of oversold conditions before there is enough sellers to do so.
With global stocks having fallen sharply, see where our analysts see stocks headed in the Q1 Global Equities Forecast.
S&P 500 Daily Chart (Resistance levels in focus)
S&P 500 Hourly Chart (Channel developing)
Dow clearing some resistance but still has more ahead
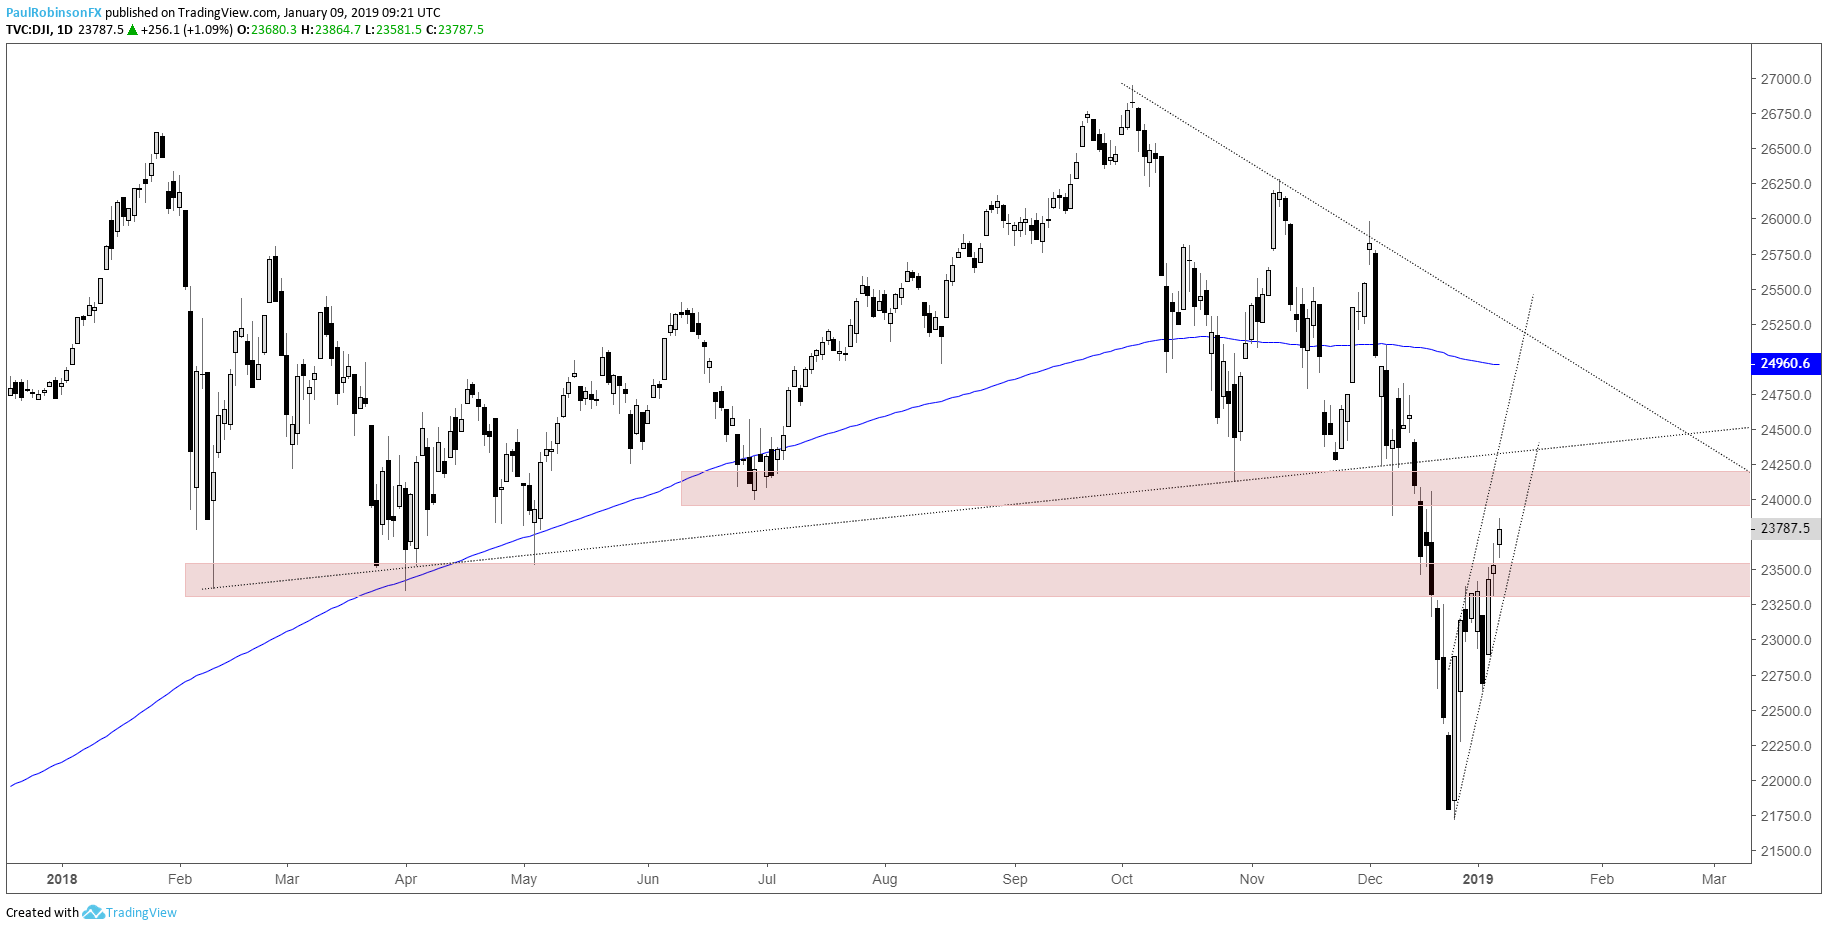
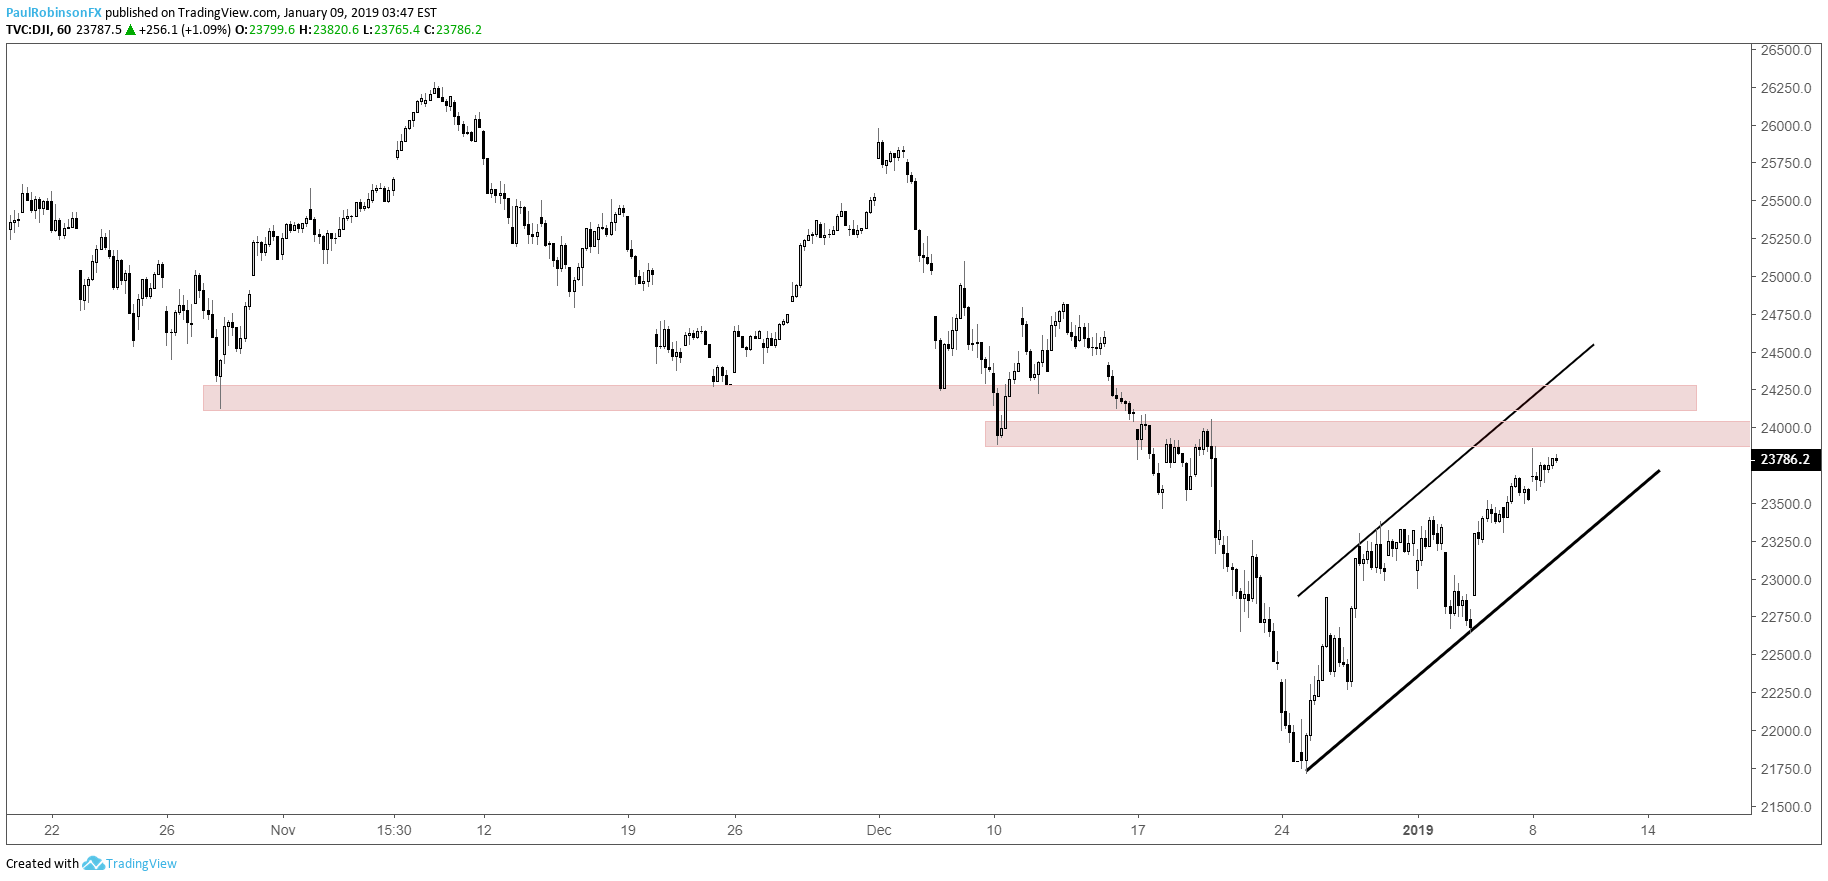
The Dow is also carrying higher into resistance levels, so far not paying much mind to the early 2018 lows. This has the index carrying up into even higher resistance levels, but one of these zones is likely to soon stick as problematic. Almost the same structure as the S&P here, using a developing channel off the December low as a guide.
Dow Daily Chart (More resistance ahead)
Dow Hourly Chart (Channel forming)
To learn more about U.S. indices, check out “The Difference between Dow, Nasdaq, and S&P 500: Major Facts & Opportunities.” You can join me every Wednesday at 10 GMT for live analysis on equity indices and commodities, and for the remaining roster of live events, check out the webinar calendar.
Tools for Forex & CFD Traders
Whether you are a beginning or experienced trader, DailyFX has several resources available to help you; indicator for tracking trader sentiment, quarterly trading forecasts, analytical and educational webinars held daily, trading guides to help you improve trading performance, and one specifically for those who are new to forex.
---Written by Paul Robinson, Market Analyst
You can follow Paul on Twitter at @PaulRobinsonFX


