


S&P 500 Technical Highlights:
- S&P 500 5% bounce sign of a trade-able low nearing?
- A drop into the 2009/18 bull market trend-line an ideal scenario
Traders are reacting to increased volatility, see how on the IG Client Sentiment page.
S&P 500 5% bounce sign of a trade-able low nearing?
Yesterday’s 5% bounce took back the prior two days of losses, making it the first time amidst this month’s plunge we’ve seen any real buying interest. While my thinking is that in 2019 we will see a sell-off to much greater depths than what has happened so far (S&P 500 – 1800-ish), it isn’t going to happen all in one fell swoop.
We may have not seen the low in this sequence of the broader decline, but the violent price action over the past three days smacks of a ‘trade-able’ low starting to form. By ‘trade-able’ low, I mean the market will have an upward tilt to it, giving looks to trade from the long-side.
How these things often play out is like this. You get a big bounce like yesterday, maybe even a little follow-through, then a jab back lower that either comes near the low or even takes it out by a short distance before quickly reversing higher again. It’s the second strong surge higher that significantly strengthens the case that a low has been forged and a ‘trade-able’ bounce is underway.
Ideally, we see another round of selling past yesterday’s low to one of the more important technical thresholds in financial markets – the 2009-18 bull market trend-line. Oversold conditions coupled with this trend-line would make for an excellent back-drop for a rally to develop.
At the time of this writing the futures are taking back some of yesterday’s gains, so we’ll see if those early losses can be erased or if this is the market wanting to already test or take out yesterday’s lows. If that is the case, watch for another turnabout (especially if the ’09 line is met).
S&P 500 Daily Chart (Trade-able low nearing...)

S&P 500 Weekly Chart (Bull market trend-line, eventually lower)
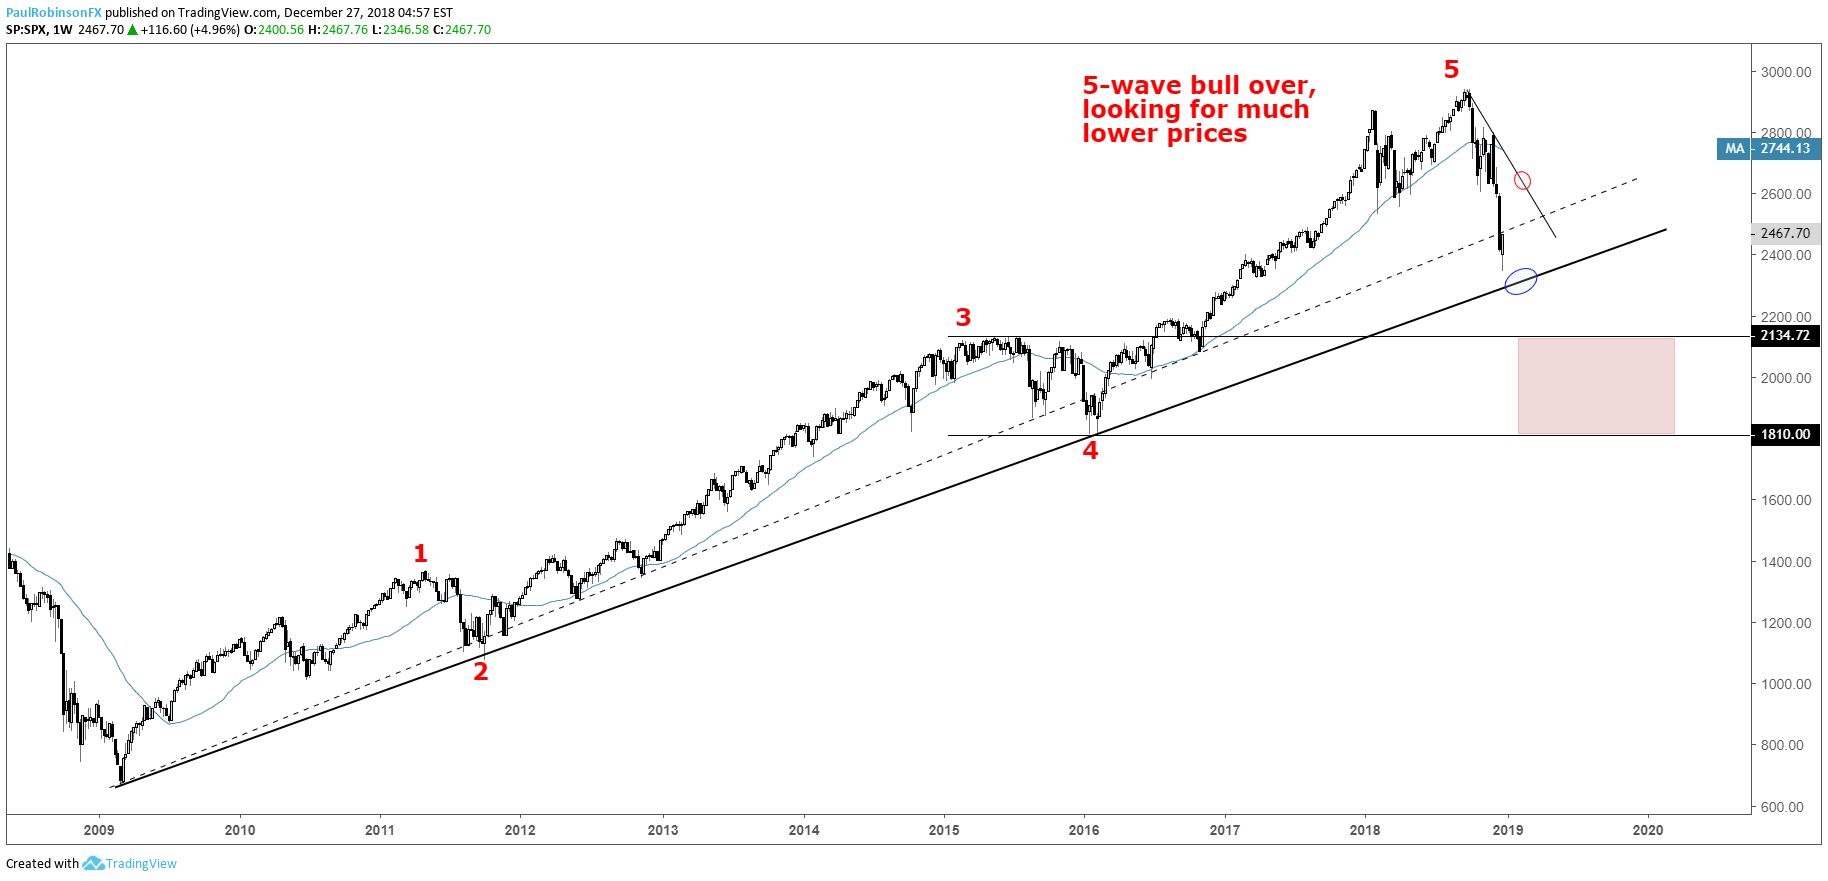
*Chart is explained in greater detail in the Q1 Equities Forecast to be released on December 29.
To learn more about U.S. indices, check out “The Difference between Dow, Nasdaq, and S&P 500: Major Facts & Opportunities.” You can join me every Wednesday at 10 GMT for live analysis on equity indices and commodities, and for the remaining roster of live events, check out the webinar calendar.
Tools for Forex & CFD Traders
Whether you are a beginning or experienced trader, DailyFX has several resources available to help you; indicator for tracking trader sentiment, quarterly trading forecasts, analytical and educational webinars held daily, trading guides to help you improve trading performance, and one specifically for those who are new to forex.
---Written by Paul Robinson, Market Analyst
You can follow Paul on Twitter at @PaulRobinsonFX


