


U.S. Indices Technical Highlights:
- S&P 500 testing broken channel, bigger trend-line, 200-day higher
- Dow Jones reversed around 200-day, April trend-line
- Nasdaq 100 hit 2016 trend-line, just shy of the 200-day
With global stocks falling sharply, see how recent events fit into our outlook for the remainder of the year in the Q4 Global Equities Forecast.
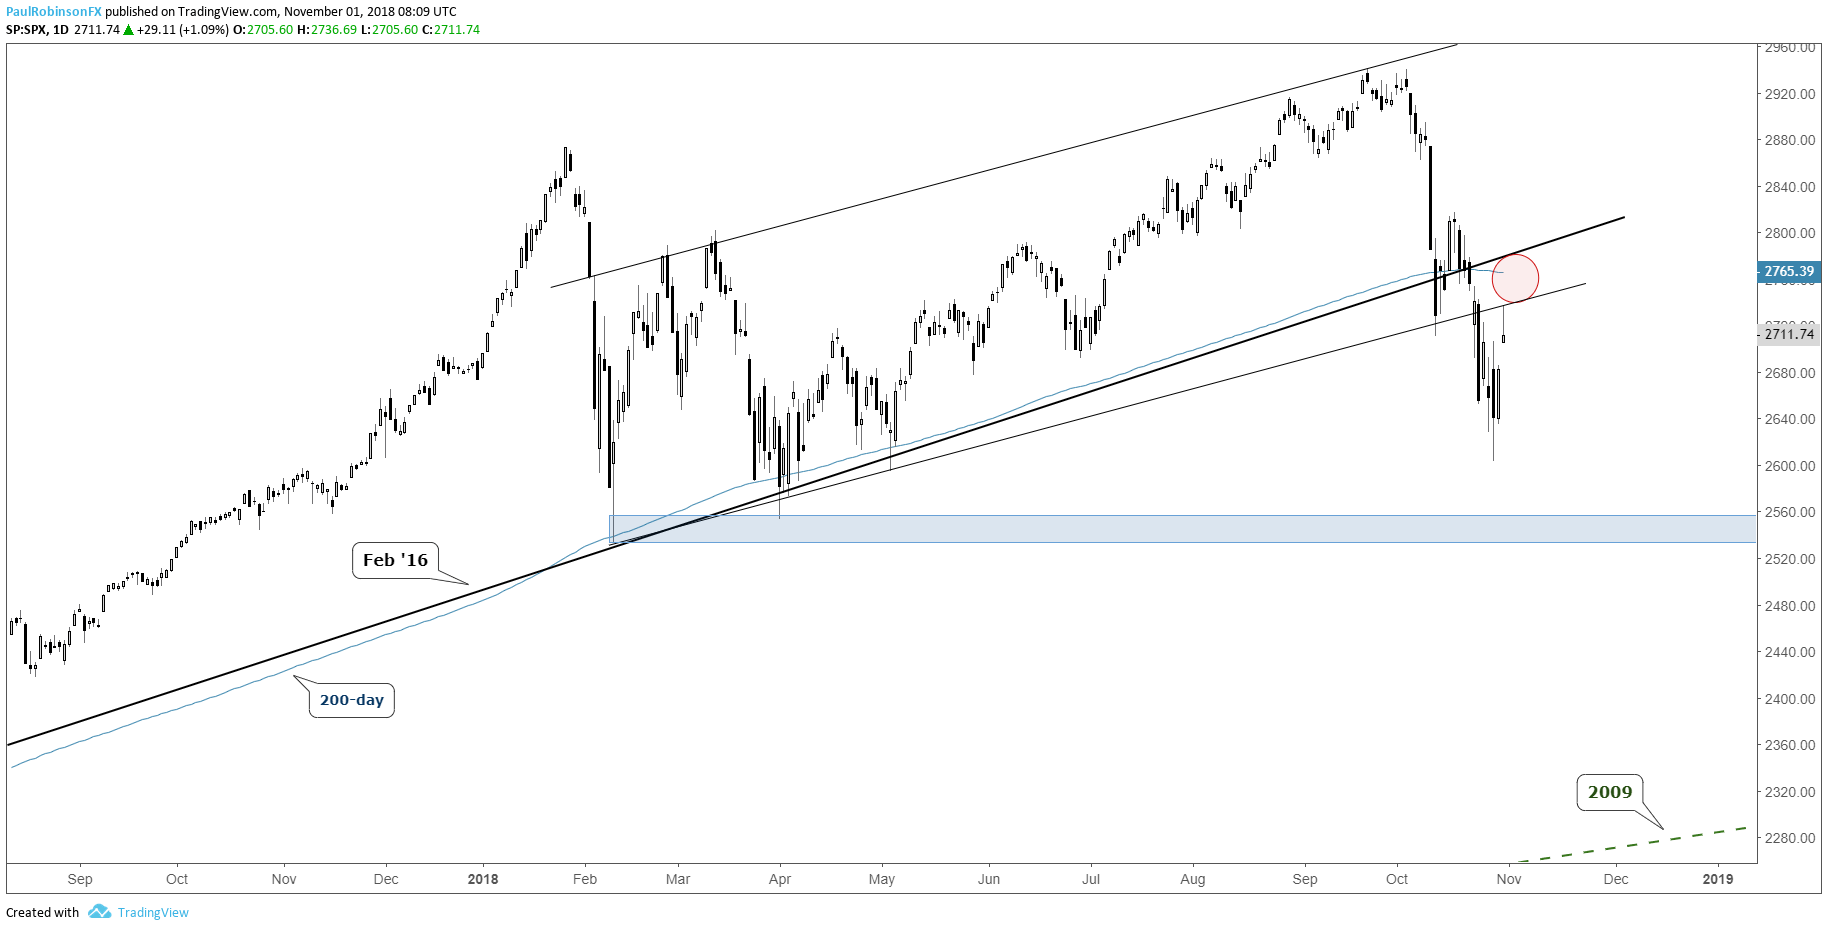
S&P 500 testing broken channel, bigger trend-line, 200-day higher
In what has been very volatile trade lately, markets are showing their bear market-like tendency to undergo swift declines followed by sharp rebounds. Will the most recent 2.5 day ramp up last or fade into another round of cascading prices?
With the bounce since Monday, indices are testing prior breakdown levels. The S&P 500 faded late-day yesterday, posting a semi-bearish reversal, from around the lower parallel of a channel running higher since February.
Pressure could come in quickly from here and at the least in the very short-term fill yesterday’s gap down to 2682 (It’s ‘only’ 30 handles away). If sellers don’t show up in earnest soon, another push higher could be in store before ending with another downdraft. A break of yesterday’s high of 2737 will have in focus the important combination of the 200-day and February 2016 trend-line (important longer-term thresholds).
Overall the market is still quite vulnerable, though, and I think we could be in for another leg lower that involves a move towards those February/April (~2550/2530) lows before we might see some type of tradeable low. Whether the next leg is set to begin now or a little higher is the immediate question on this end.
See how traders are reacting to the increased volatility on the IG Client Sentiment page.
S&P 500 Daily Chart (resistance tests)
Dow Jones reversed around 200-day, April trend-line
After tagging the February 2016 trend-line earlier in the week, the bounce in the Dow took it up beyond the April trend-line and 200-day yesterday, but put in a poor finish around these thresholds. If we don’t see trade above yesterday’s high of 25336, look for price to fall back towards the February 2016 trend-line and eventually break it if we are indeed to see those earlier-year lows.
Dow Daily Chart (Retest April t-line, 200-day)

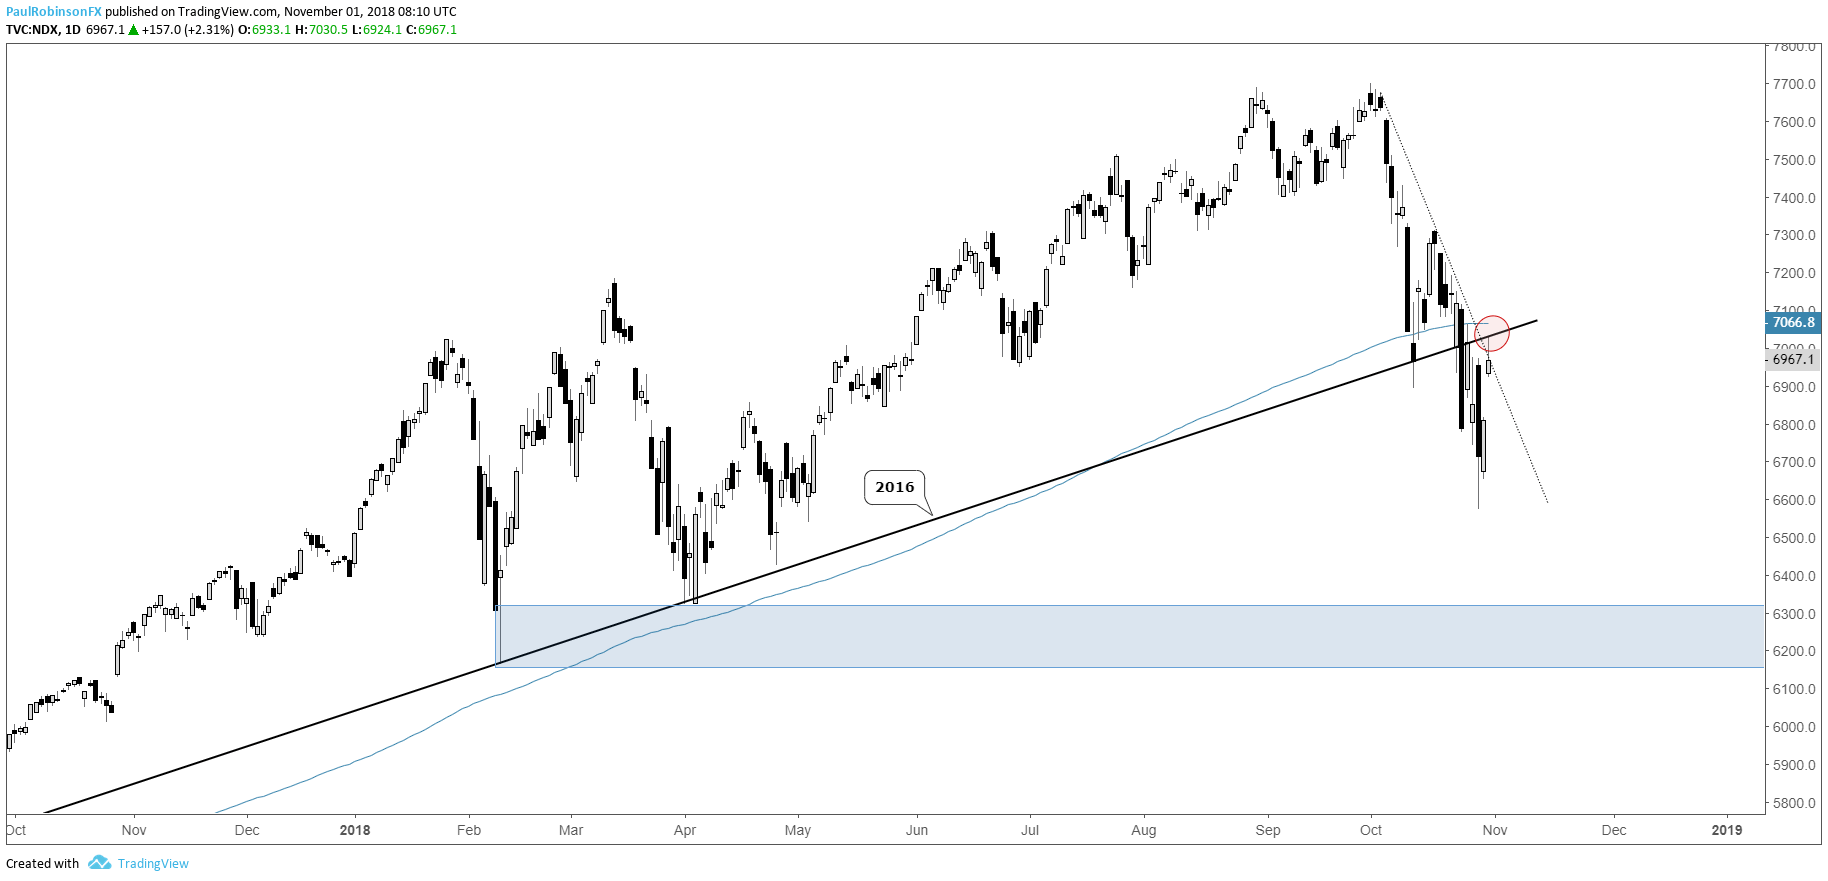
Nasdaq 100 hit 2016 trend-line, just shy of the 200-day
The Nasdaq 100 tested the June 2016 trend-line yesterday and came very near the 200-day MA. In line, of course, with the other indices we will see soon if this is all this latest bounce has left in it. It will be tough to recapture those broken thresholds, and if momentum turns down again here, look for yesterday’s big gap to quickly fill and a move towards the weekly lows and worse to ensue. The early-year lows don’t arrive until down in the 6330/160-area.
Nasdaq 100 Daily Chart (Retest of 2016 t-line, near 200-day)
You can join me every Tuesday at 9 GMT for live analysis on equity indices and commodities, and for the remaining roster of live events, check out the webinar calendar.
Tools for Forex & CFD Traders
Whether you are a beginning or experienced trader, DailyFX has several resources available to help you; indicator for tracking trader sentiment, quarterly trading forecasts, analytical and educational webinars held daily, trading guides to help you improve trading performance, and one specifically for those who are new to forex.
---Written by Paul Robinson, Market Analyst
You can follow Paul on Twitter at @PaulRobinsonFX


