S&P 500 Technical Highlights:
- Things have suddenly become critical
- Big test of confluent trend support just ahead
- 200-day + Feb 2016 trend-line = big threshold
With global stocks falling sharply, see how recent events fit into our outlook for the remainder of the year in the Q4 Global Equities Forecast.
Things have suddenly become critical for the S&P 500
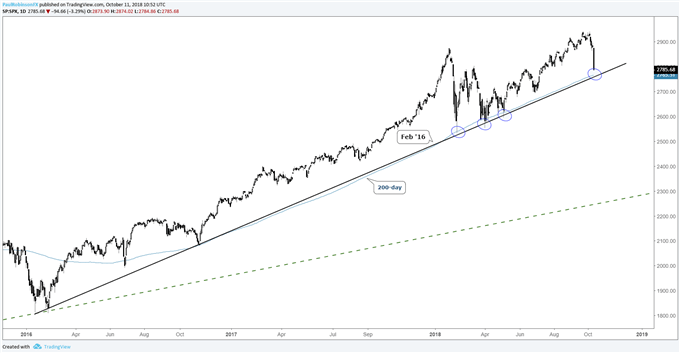
Yesterday’s 3% swoon in the S&P 500 has the market on the verge of testing major long-term trend support. The powerful combination of the trend-line running up from the end of the 2015/16 correction and the 200-day MA are viewed as quite significant, and the market agrees.
Earlier in the year the confluent support was tested on three occasions after the top in January, holding each time. This forged the ‘line-in-the-sand’ even further. At the time of this writing the S&P will be gapping down into this critical area.
How the market responds will be very telling. As per usual we will give it the benefit of the doubt that it will hold, at least on this initial test. Watch for a wild turnabout to determine whether the market wants to try and mount a rally.
Should we see yet another day of heavy selling and a strong close below, then the expectation is that the market could be in for much larger losses in the days/weeks ahead. The Nasdaq 100 is well outside of the rising wedge we’ve been looking at, suggesting a breakdown is quite possible. See “Nasdaq 100, FAANG Charts and What They Could Mean for the Whole Market”.
Retail traders have been covering their shorts into the sell-off, see the IG Client Sentiment page for details as to what this may mean.
S&P 500 Daily Chart (Feb ’16 t-line, 200-day MA)

You can join me every Tuesday at 9 GMT for live analysis on equity indices and commodities, and for the remaining roster of live events, check out the webinar calendar.
Tools for Forex & CFD Traders
Whether you are a beginning or experienced trader, DailyFX has several resources available to help you; indicator for tracking trader sentiment, quarterly trading forecasts, analytical and educational webinars held daily, trading guides to help you improve trading performance, and one specifically for those who are new to forex.
---Written by Paul Robinson, Market Analyst
You can follow Paul on Twitter at @PaulRobinsonFX


