S&P 500 Highlights:
- S&P 500 consolidating after triangle/trend-line breakout
- 2800+ next objective on a breakout
- A strong drop through bottom of consolidation negates outlook
See what factors have been driving the S&P 500 and find out how our Top Trading Opportunities for 2018 are doing so far on the Trading Guides page.
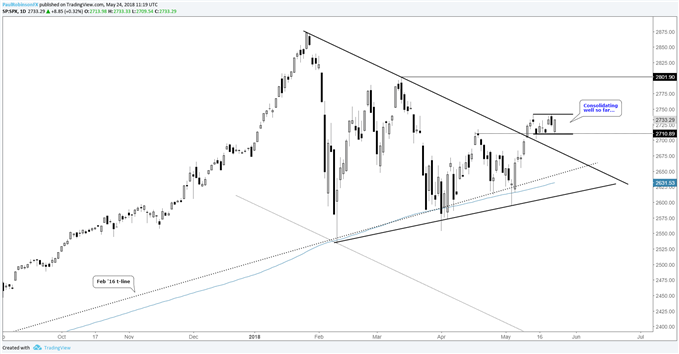
When we last looked at the S&P 500 (& Dow) on Friday, the question we asked was, “Is the market consolidating or ready to roll over?” Since then, the market has worked its way sideways, that is, it’s undergoing a period of consolidation. This is also developing after trading above the trend-line off the highs and above the swing-high in April, bullish events in their own right.
Yesterday’s gap-down in the morning was bought relatively aggressively during the afternoon, which further bolsters the notion that the market wants to rally. Given the period of consolidation is going on two weeks, a breakout could come at any time. A move above 2742 should have the market in rally-mode again, with the next level of price resistance not arriving until around 2800, the March swing-high.
Technical events which would derail a bullish outlook – a decline through the bottom of the range or a breakout above 2742 which quickly fails back inside the range, and ultimately back through the bottom of it. In the event either happens, a forceful decline could develop as a bullishly postured market is caught leaning the wrong way.
Confidence is key, check out this guide for 4 ideas on Building Confidence in Trading
S&P 500 Daily Chart (Consolidating)

If you’d like to listen in on live technical analysis on global equity indices (and commodities), join me every Tuesday at 9 GMT time.
Resources for Forex & CFD Traders
Whether you are a new or experienced trader, we have several resources available to help you; indicator for tracking trader sentiment, quarterly trading forecasts, analytical and educational webinars held daily, trading guides to help you improve trading performance, and one specifically for those who are new to forex.
---Written by Paul Robinson, Market Analyst
You can follow Paul on Twitter at @PaulRobinsonFX


