


S&P 500/Dow/Nasdaq Highlights:
- S&P 500 turn lower has big support in focus
- Dow may have cemented major 2nd lower-high
- Nasdaq 100 closing in on neckline of head-and-shoulders
See what factors are expected to drive the S&P 500 this quarter, along with the Top Trading Opportunities for 2018 on the Trading Guides page.
U.S. stocks may soon be in big trouble with topping patterns maturing
Last week when we discussed U.S. indices, the S&P 500 showed signs of wanting to trade higher in the very short-term, but we also noted: “Looking at the broader picture, though, the upside is still at considerable risk with the potential for a top to form still very much alive.”
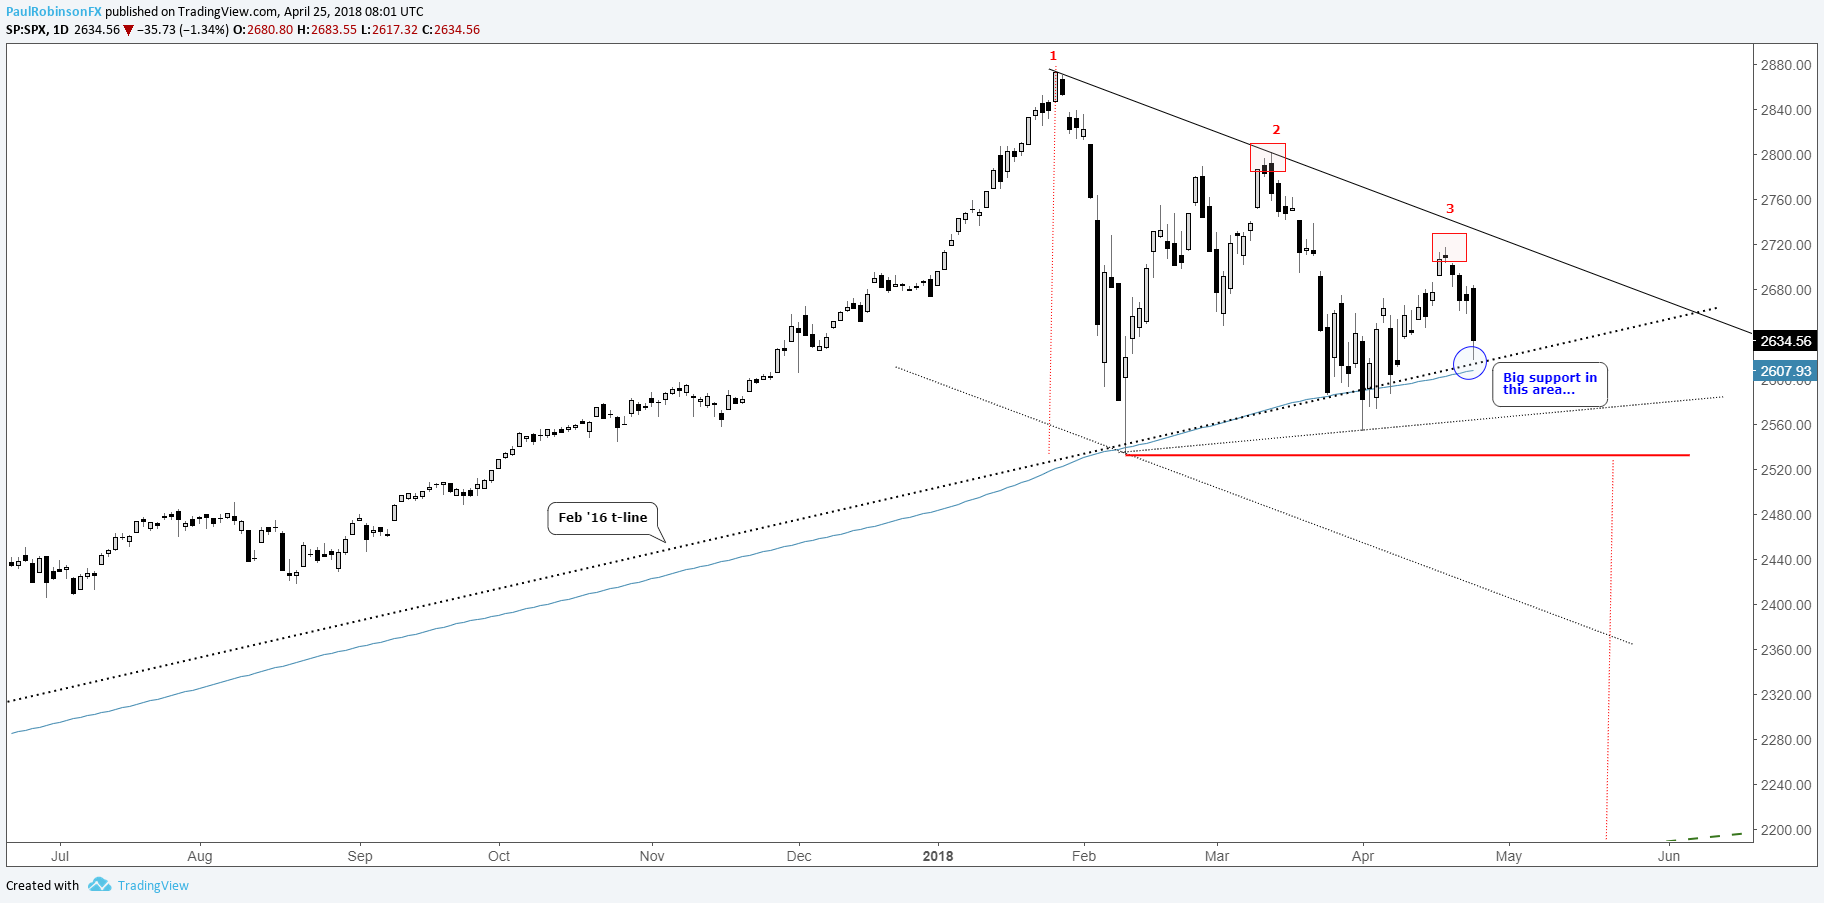
Indeed, with price action the past few days taking a strong turn lower, risk of a top continues to grow. The S&P didn’t quite make it to the trend-line off the record high, considered the ‘ideal’ spot to look for a short, but nevertheless a 2nd lower high (3rd peak), a very important one, may have been carved out.
The 200-day MA and February 2016 trend-line are running together and make for a pretty significant area of rising support. The sharp reversal on Feb 9 and wild swings seen in late March, early April around the confluence of support cemented its importance.
A break below support will quickly bring in a relatively flat bottom of a descending wedge-like pattern, and if all levels formed from February to now are broken (<2532) it would likely mean the market is in for a significant decline. A measured move target points to around 2200, where the bull market trend-line from the 2009 lies.
But before letting excitement over higher volatility run ahead of us (and if the market declines to that point vol will certainly be elevated), we’ll continue to respect support, but it may not be long before major support becomes major resistance.
S&P 500 Daily Chart (Price action growing increasingly bearish)
Dow may have cemented major 2nd lower-high
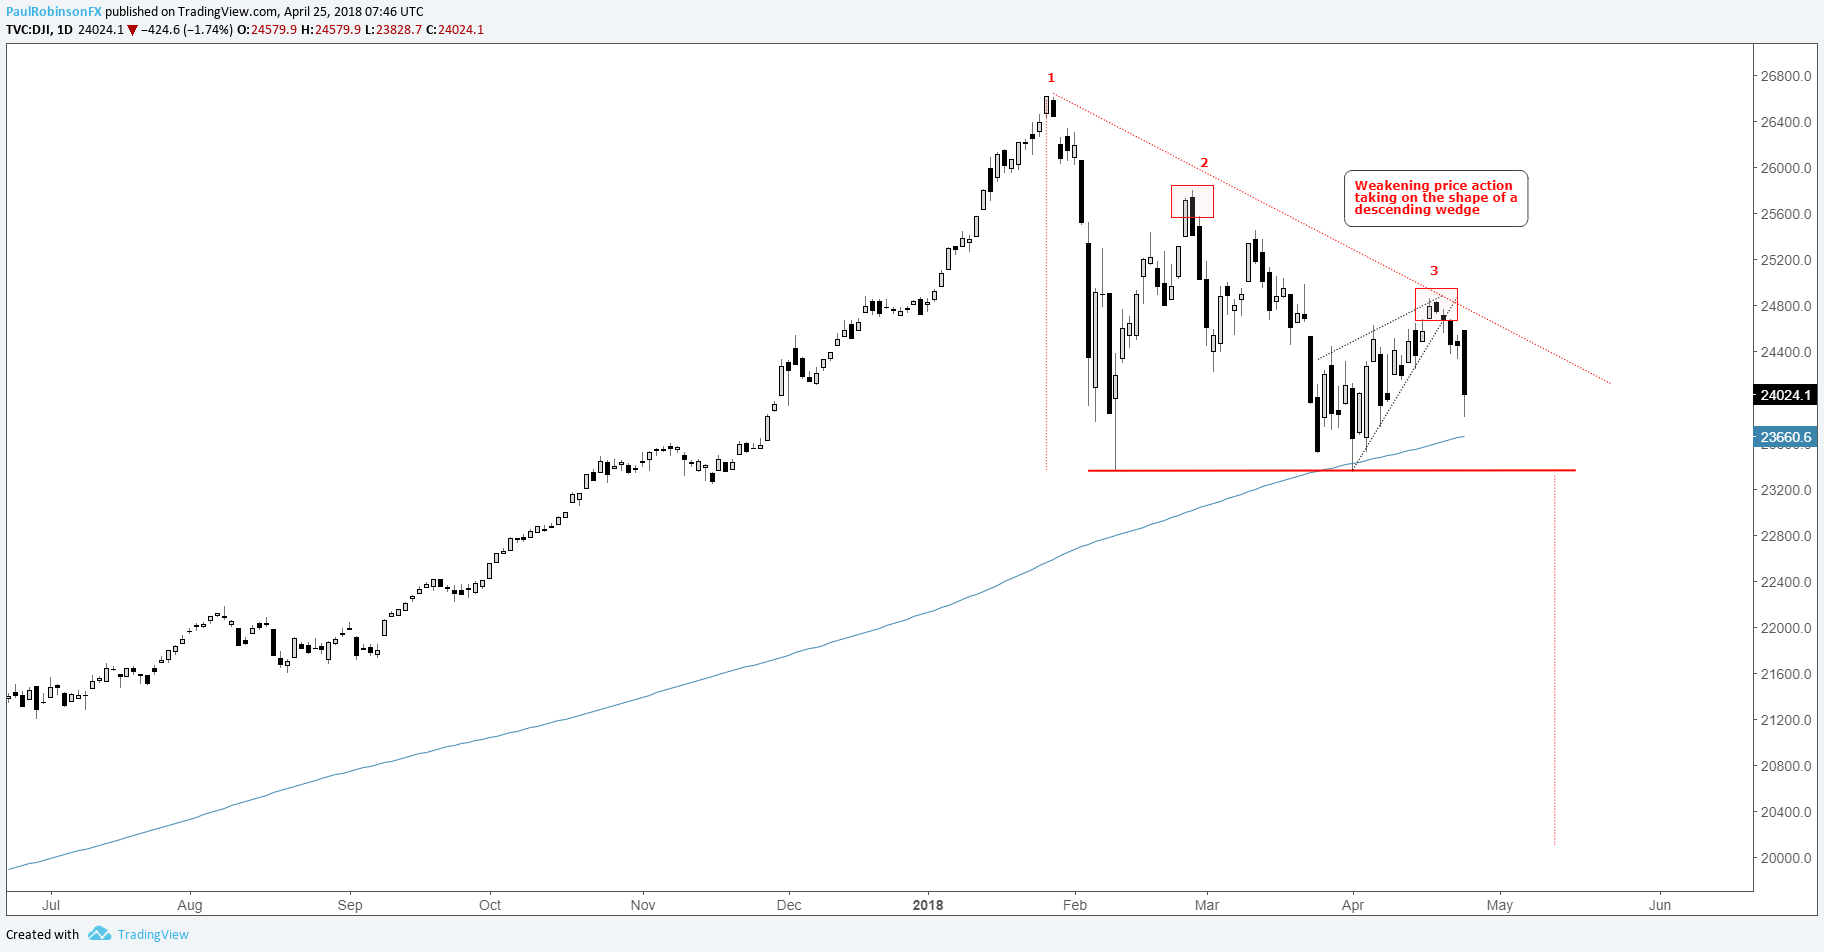
The Dow’s turn lower, similar to the S&P, mark a 2nd lower high (3rd peak), with 23340 as the major level of support to keep an eye on. The general structure since January is taking on a descending wedge top, a scenario we laid out earlier in the month (S&P 500 & Dow Jones…Big Top & Drop in the Cards). Should we see a close below price support, the 200-day MA will have also been breached in the process. The range of price action since January points to a move to down near 20k on a confirmed break.
Struggling with the rise in volatility? We’ve got a guide designed to help you – Building Confidence in Trading.
Dow Daily Chart (Wedging lower)
Nasdaq 100 closing in on neckline of head-and-shoulders
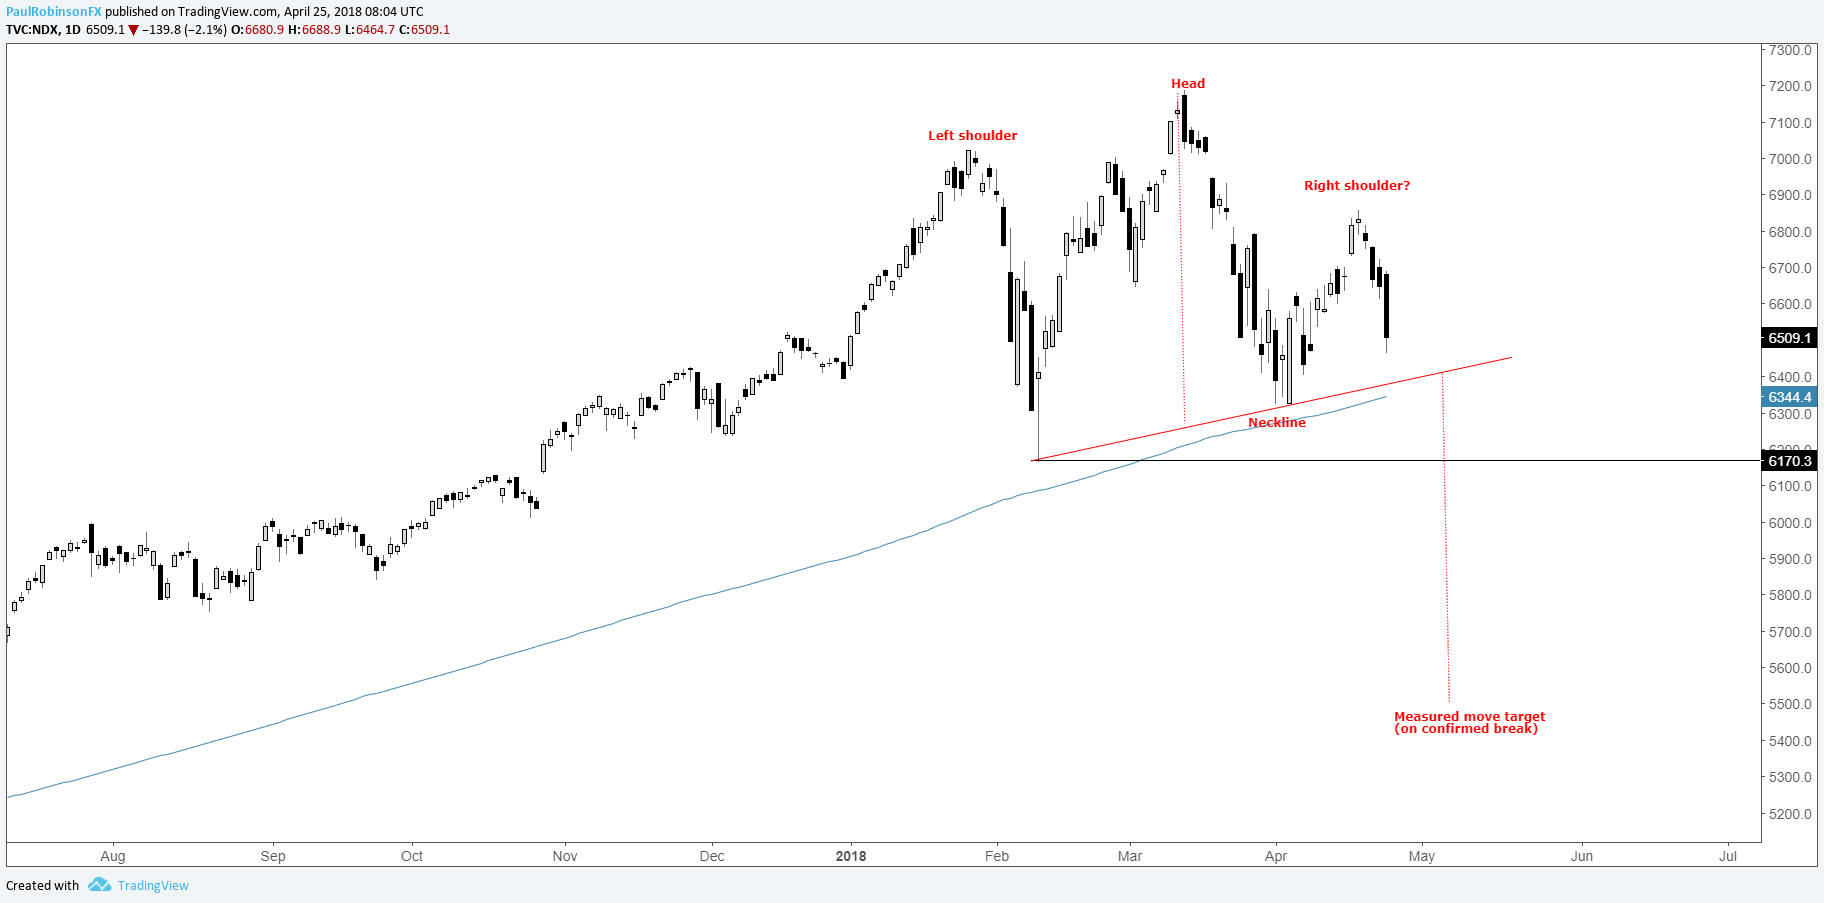
The Nasdaq 100 has the clearest price sequence of the three major U.S. indices, with a head-and-shoulders pattern coming squarely into view. The neckline of the pattern roughly lines up with the 200-day MA. Necklines are support until broken, so the pattern isn’t technically validated until that happens.
With that said, jumping the gun, shorting in anticipation of a break can lead to a disappointing outcome. Should it break, the other indices will have likely broken their respective support levels or at least be very near doing so. The measured move target, based on the height of the formation, is ~5500 upon confirmation.
Nasdaq 100 Daily Chart (Head-and-shoulders)
If you’d like to listen in on live analysis pertaining to global equity indices (and commodities), join me every Tuesday at 10 GMT time for technical insights.
Resources for Forex & CFD Traders
Whether you are a new or experienced trader, we have several resources available to help you; indicator for tracking trader sentiment, quarterly trading forecasts, analytical and educational webinars held daily, trading guides to help you improve trading performance, and one specifically for those who are new to forex.
---Written by Paul Robinson, Market Analyst
To receive Paul’s analysis directly via email, please SIGN UP HERE
You can follow Paul on Twitter at @PaulRobinsonFX


