


S&P 500 Highlights:
- S&P 500 working its way higher, but in unconvincing fashion
- Significant lower-high, or working its way towards record highs?
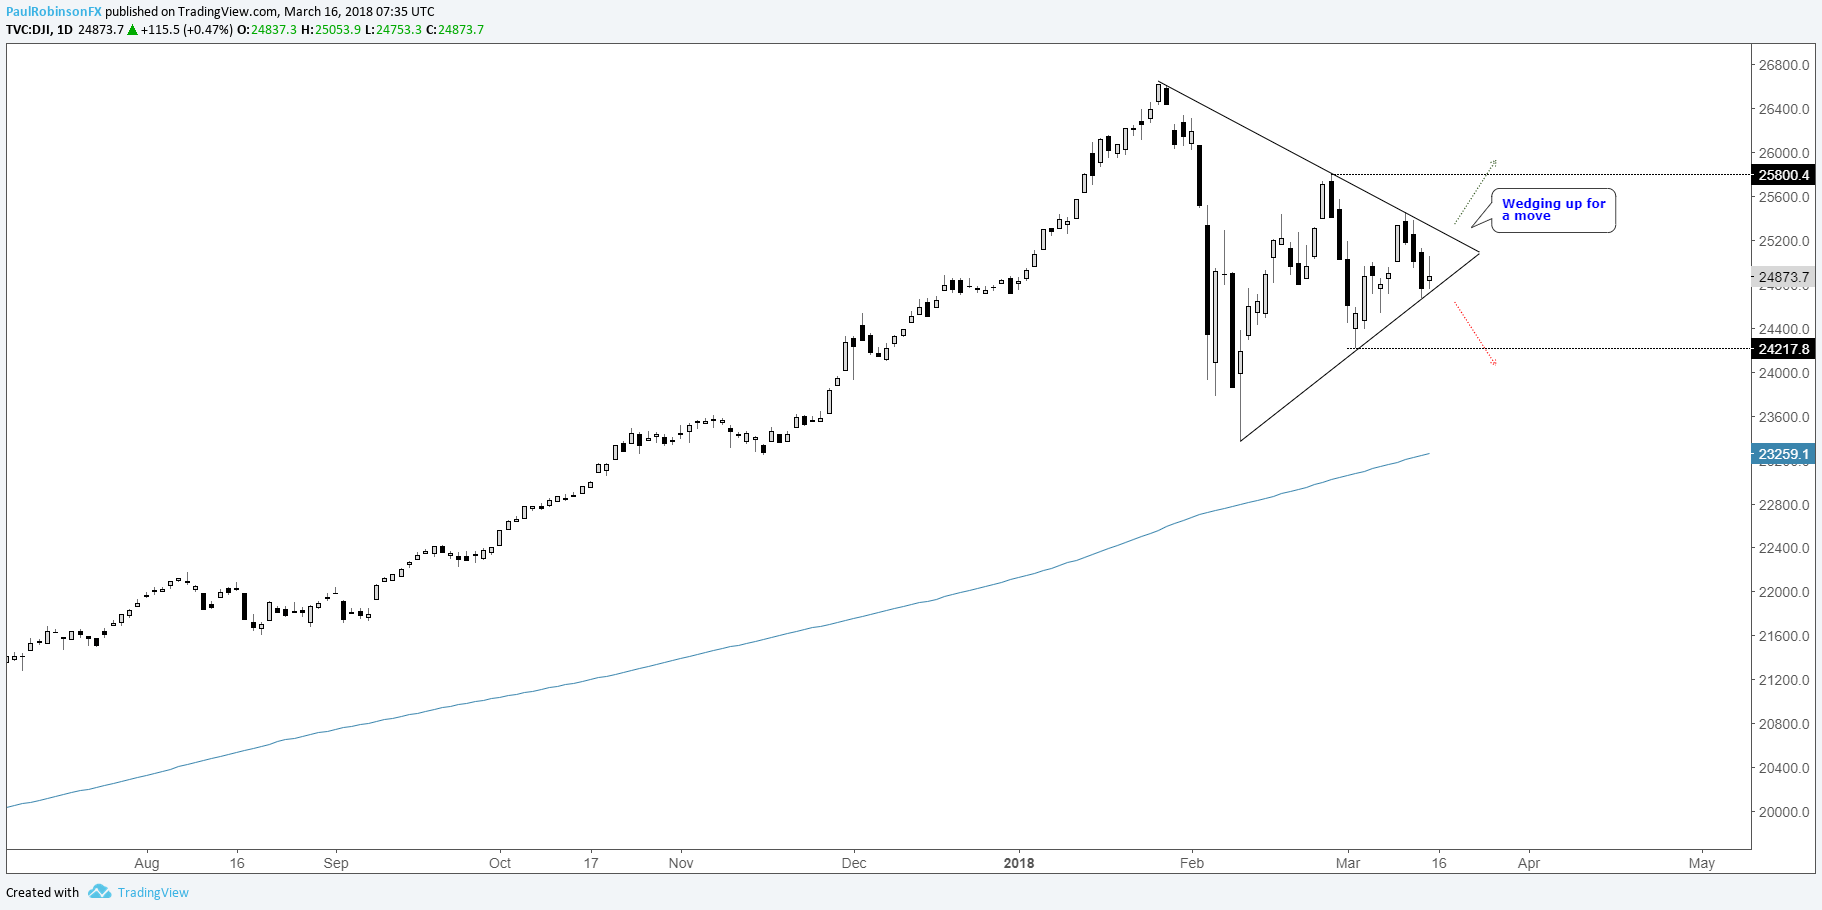
- Dow Jones move out of wedge may provide the answer
Check outour team of analysts’ Top Trading Opportunities for 2018, check out the DailyFX Trading Guides.
Since the plunge off record highs and initial rebound, the S&P 500 has been in limbo as market participants sort out whether we’ve seen a significant high or not. Thus far, the market is trading relatively bullish with a higher low and slight higher high in place since last month’s low. But it’s not very convincing price action just yet given the lack of momentum.
The Nasdaq 100 quickly shot back to record highs, but the index is largely driven by a select few household names (Google, Facebook, Apple, etc), so it’s new high is taken with a wary eye. The Russell 2000, a small-cap index, neared its old record earlier this week. This at first would appear bullish given the higher beta names which these indices consist of, especially the R2K, and the market’s willingness to take on the risk. However, the broader and most significant index, the S&P 500, still offer signs of caution.
Let’s turn to a chart which is beginning to present the most clarity, ironically, through its lack of clarity. The back-and-forth price action in the Dow Jones Industrial Average (DJIA) is taking on the shape of a large symmetrical wedge, which suggests the market is on the verge of deciding on a direction. There was one we noted in the S&P 500 last week, but this one has better symmetry.
A top-side breakout will have the old record highs in focus, while a breakdown points to a topping scenario leading markets lower. There could be an initial head-fake out of the pattern; that is, a jab to the top or bottom-side followed by a sudden reversal in the intended direction, so waiting for an initial breakout to garner momentum will be prudent.
Struggling with the rise in volatility? We’ve got a guide designed to help you – Building Confidence in Trading.
Dow Jones Daily Chart (wedge nearing breakout)
Getting back to the S&P 500, specifically; trading above the weekly high will also correspond with a bullish break by the Dow and quickly have the all-time high at 2872 in focus. Should we see a downside break it will take a hard spill to breach the first level of price support at 2647, but will likely happen if a breakdown in the Dow is for real. In this case, the 2016 trend-line in confluence with the 200-day MA will be vulnerable to a break and big leg lower. An event we’ll follow up on should the scenario come to light.
The bottom line: the market is in limbo – it’s a 50/50 call right now, lower-high or rally – but the DJIA may soon provide us with the directional cue we’re looking for.
S&P 500 Daily Chart

If you’d like to listen in on live analysis pertaining to global equity indices (and commodities), you can join me every Tuesday at 10 GMT time for my technical insights.
S&P 500 Trader Resources
Whether you are a new or experienced trader, we have several resources available to help you; indicator for tracking trader sentiment, quarterly trading forecasts, analytical and educational webinars held daily, trading guides to help you improve trading performance, and one specifically for those who are new to forex.
---Written by Paul Robinson, Market Analyst
To receive Paul’s analysis directly via email, please SIGN UP HERE
You can follow Paul on Twitter at @PaulRobinsonFX


