


S&P 500 Highlights:
- S&P 500 failing to hold intra-day rallies, closing weak past few days
- If we see no down-side follow-through soon, consolidation in the works
- Price levels and tactical considerations outlined
To view the longer-term technical and fundamental outlook for the S&P 500, or to see our top trade ideas for 2018, check out the DailyFX Trading Guides.
The question on the market’s mind is whether or not the bounce off the lows in the S&P 500 will result in a lower-high or eventually carry on to a new high. At this juncture, it still looks like it could go either way regarding the big-picture, but recent price action has been providing some clues for the short-term.
Wednesday’s attempt to forge out a new high from last week was swatted down not long after the rally following the release of the January FOMC minutes. It looked as though the reversal might turn the market lower, but yesterday’s intra-day rebound started to tap on the brakes to that idea until the market reversed, again.
It was the fourth day in a row the market has been unable to hold onto a rally, with the last two the most important. In the near-term a decline looks likely to set-in and further test the recent bounce as we initially thought coming into the week.
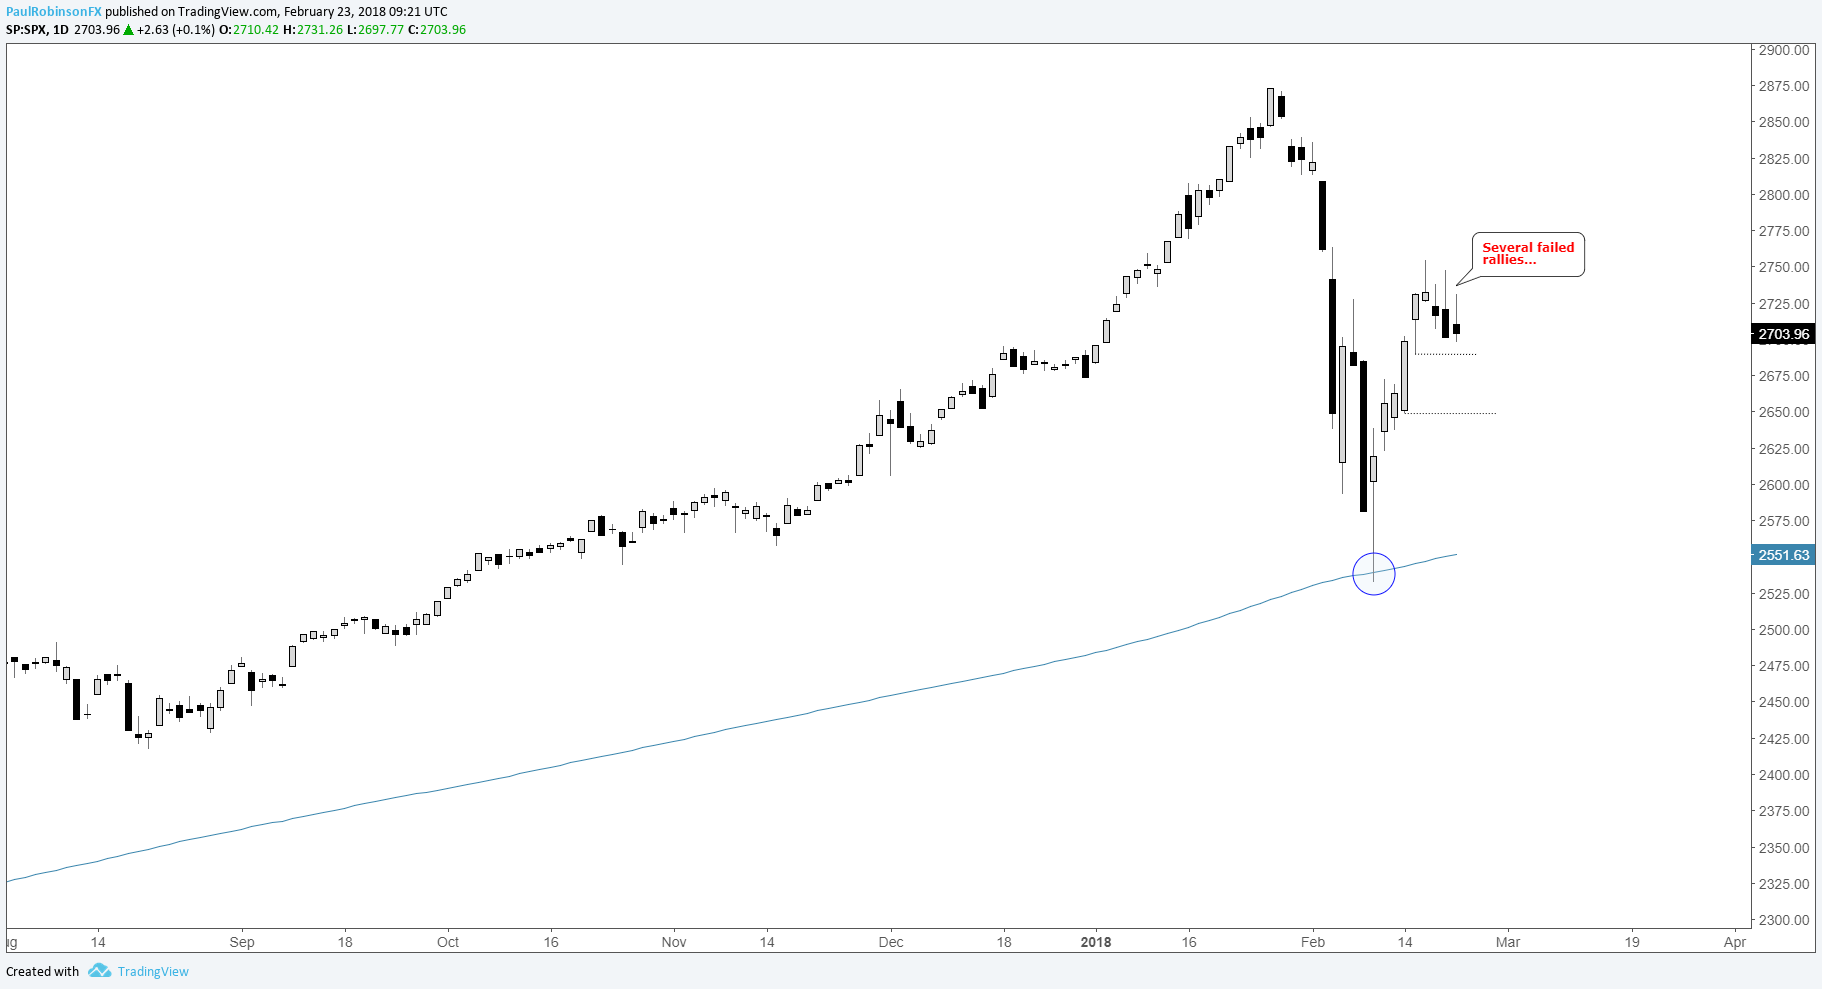
Downside levels start clocking in at 2690, then nothing all that visible until the 2/14 day-low at 2649. However, neither are considered significant levels given they are only recent daily lows. For now, we’re working with the notion we will see short-term follow-through to the downside and take it from there.
On the flipside, if the market can manage to hang on and trade higher, and actually hold onto a gain, then the recent period may just be a part of a broader congestion pattern. If that turns out to be the case, then patience will be required until we see a resolution.
Struggling with rising volatility? We’ve got a guide designed to help you – Building Confidence in Trading.
S&P 500 Daily Chart
If you’d like to listen in on live analysis pertaining to the S&P 500 and other indices (and commodities), you can join me every Tuesday at 10 GMT time for my technical insights.
S&P 500 Trader Resources
Whether you are a new or experienced trader, we have several resources available to help you; indicator for tracking trader sentiment, quarterly trading forecasts, analytical and educational webinars held daily, trading guides to help you improve trading performance, and one specifically for those who are new to forex.
---Written by Paul Robinson, Market Analyst
To receive Paul’s analysis directly via email, please SIGN UP HERE
You can follow Paul on Twitter at @PaulRobinsonFX


