


S&P 500 Highlights:
- VIX spike driven by fear and short-vol covering, points to a low
- S&P 500 sharp rally on gap-down to trend-line support a solid positive
- Decline didn’t result in much of a macro shuffle, points to ‘correction-only’
To view the longer-term technical and fundamental outlook for the S&P 500, or to see our top trade ideas for 2018, check out the DailyFX Trading Guides.
VIX spike driven by fear and short-vol covering, points to a low
The drop off the highs in the market has been fierce, clearly catching the market off guard. It caused a dramatic rise in the CBOE Volatility Index (VIX). The spike was driven by both market participants seeking downside protection and short volatility traders scrambling to cover.
The VIX spiking to levels only seen a handful of times during its existence dating back to the early 90s suggests the selling in the S&P 500 is overdone, and even more-so in the Dow where we’ve seen an even more dramatic decline. In any event, the sharp plunge and reversal across the board coupled with the VIX going vertical points to a bottom.
VIX Weekly Chart

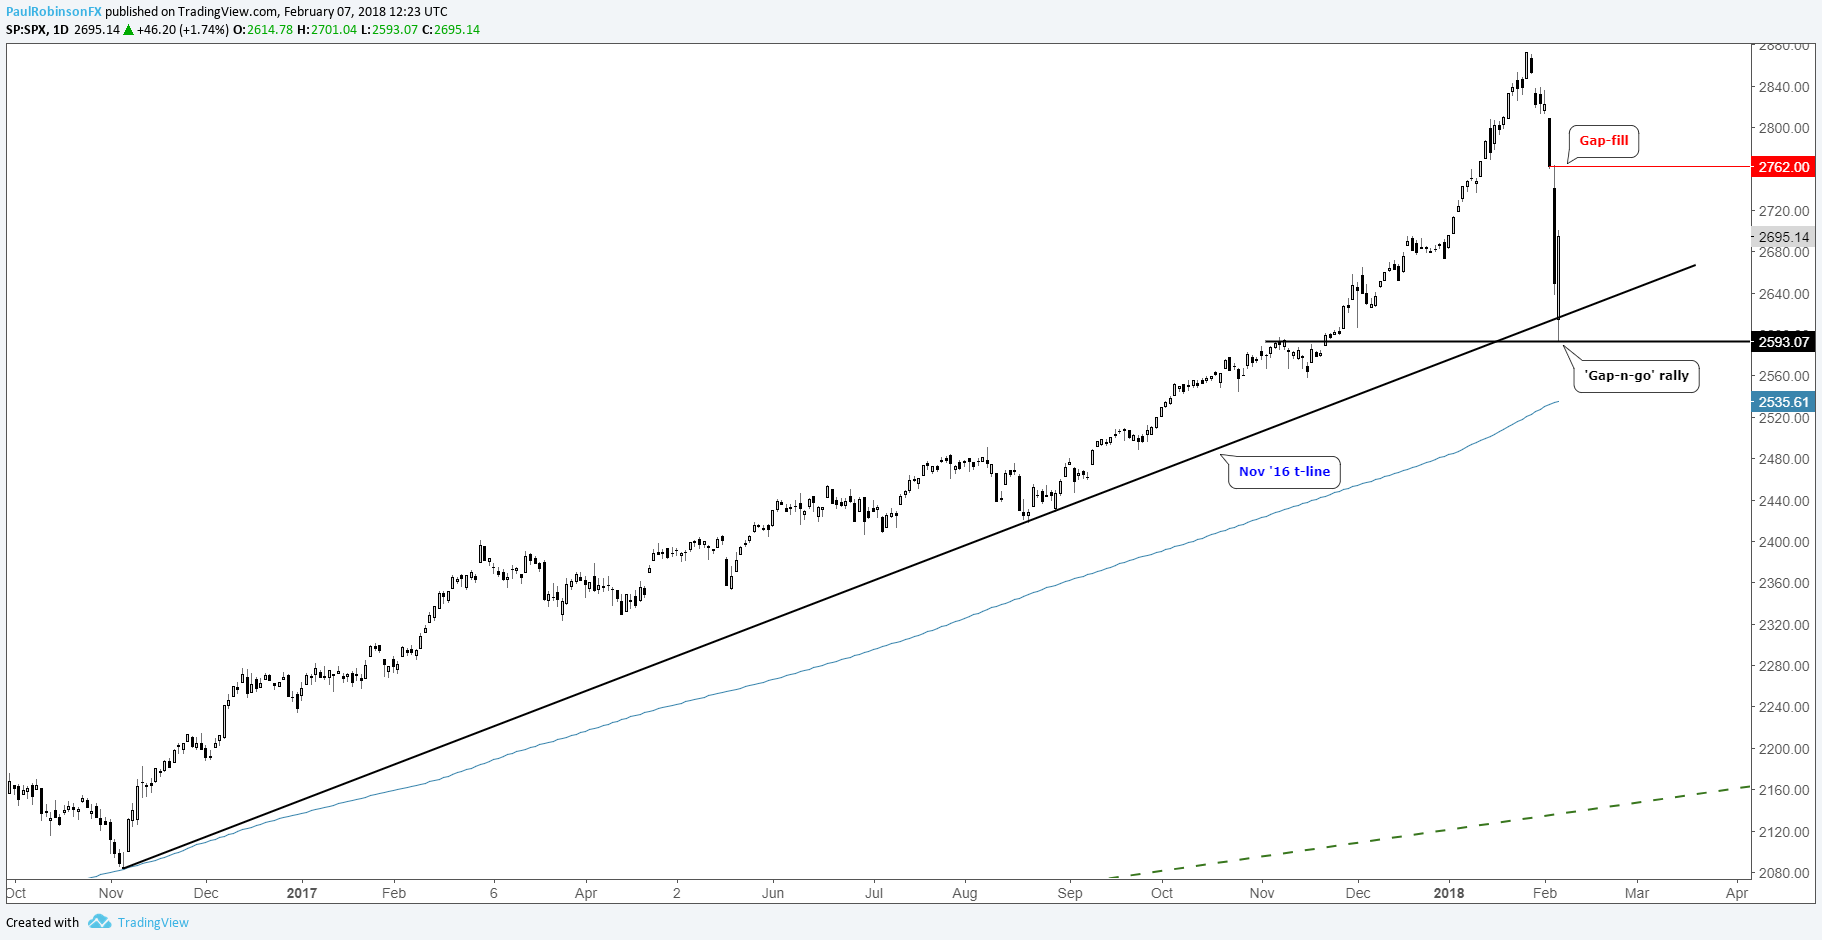
S&P 500 sharp rally on gap-down to trend-line support a solid positive
Yesterday, the S&P gapped down to the trend-line dating back to the November 2016 low. It’s a good line to look for the market to hold, but if it breaks it doesn’t necessarily mean a much larger breakdown will occur. Again, the rare VIX spike is pointing to a low close-by. In the event of more selling the 200-day will be targeted on a break of the trend-line and yesterday’s low.
In the near-term, on the top-side watch for a gap-fill of the void from 2741 up to 2762. Broadly speaking, it wouldn’t be surprising after a little ‘backing-and-filling’ (retest of the lows or mild pullback) that we see the market trade to new record highs.
Struggling with volatility rising sharply? We’ve got a guide designed to help you – Building Confidence in Trading.
S&P 500 Daily Chart
Decline didn’t result in much of a macro shuffle, points to ‘correction-only’
The dramatic decline off the highs, given the mild spillover to other asset classes smacks more of a correction in speculative fervor, rather than a larger macro-shift. We saw very modest safe-haven flows, which so far makes this more of an equity market situation, then something more pervasive. For example, gold rallied modestly for about a day-and-a-half, but once U.S. equities started their sharp snapback yesterday, precious metals fell apart with even more force than they rallied. A weak safe-haven bid.
If you’d like to listen in on live analysis pertaining to global equity indices (and commodities), you can join me every Tuesday at 10 GMT time for my technical insights.
Trader Resources
Whether you are a new or experienced trader, we have several resources available to help you; indicator for tracking trader sentiment, quarterly trading forecasts, analytical and educational webinars held daily, trading guides to help you improve trading performance, and one specifically for those who are new to forex.
---Written by Paul Robinson, Market Analyst
To receive Paul’s analysis directly via email, please SIGN UP HERE
You can follow Paul on Twitter at @PaulRobinsonFX


