


S&P 500 Highlights:
- S&P 500 tacked on 5.6% last month as ‘Blow-off’ keeps on keeping
- Month examined from a historical perspective in context trading at all-time highs (ATHs)
- Short-term weakness may set in, but historical trends favor more strength
For a longer-term fundamental and technical view on the S&P 500 and other major markets, see the DailyFX Q1 Forecasts.
S&P 500 tacked on 5.6% in January as ‘Blow off’ keeps on keeping
To end the first month of year, the S&P 500 rallied 5.6 %. Indeed, a big monthly gain (9th best January since S&P began), especially considering it’s not coming after some type of capitulation-type bottom where large snapbacks are the norm. The advance in recent months, as we discussed the other day, has the feel of a ‘blow-off’ top.
Chart – S&P 500: Monthly
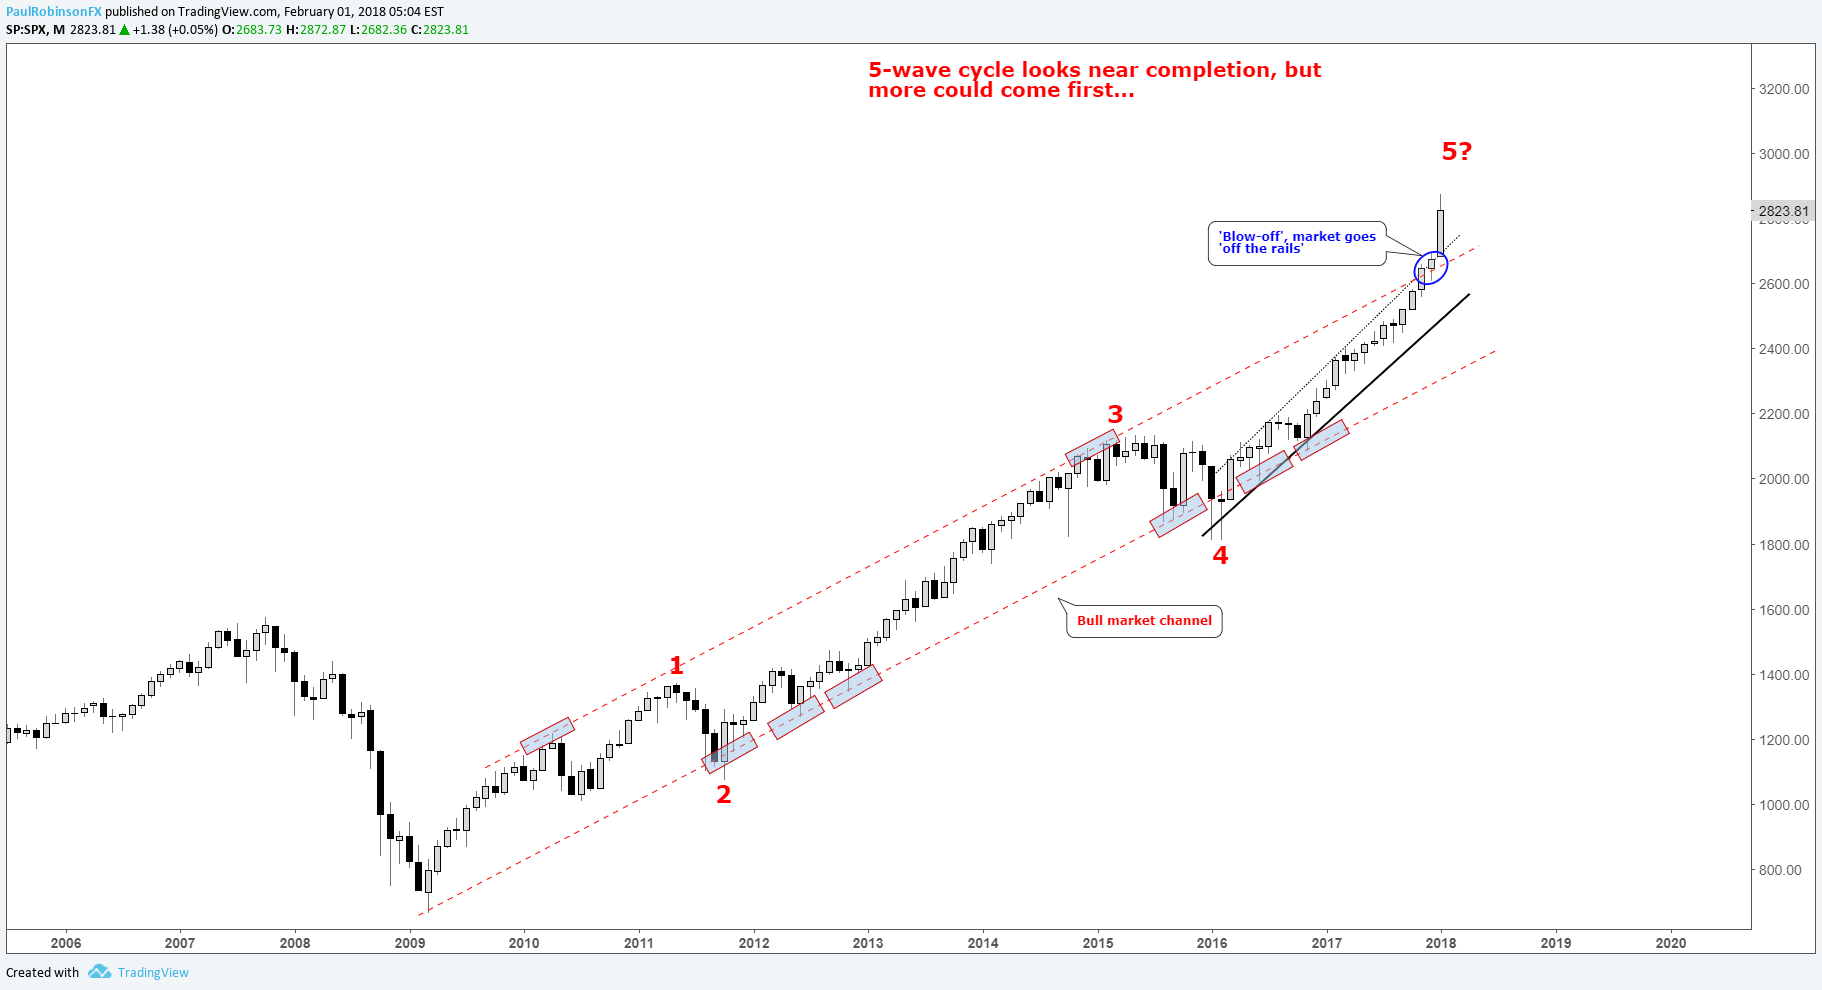
The market trading beyond the upper parallel of the bull market channel suggests we are in a ‘blow-off’ stage. It also appears to be developing in the final leg of a 5-wave Elliot-wave sequence. This points to the notion we may be nearing a major correction/bear market.
But, that view comes from looking at the market from 30,000 km above. So, what does last month’s big gain mean; was last month a sign of the end? History tells us, probably not. Macro-shifts don’t typically happen overnight, as the following data suggests.
History suggests ‘blow-off’ could continue
Let’s take a look at other times during the S&P 500’s existence when it was trading at an all-time high (ATH) and experienced a monthly gain of 5% or more, as well as subsequent performance over the next 1, 3, and 6-month periods.
Since 1960, there were 31 times the market rose 5% or more to a new record high. Of those instances, 58% of the time the market was higher one month later, three and six months later the figure rises to 68% for both periods. Compared to random returns, the market has been higher 59% of the time looking out a month, 65% of the time three months later, and 69% of the time after six months.
Big decline more likely to unfold after period of moderate weakness
As far as historical data is concerned, the fact the market has gone vertical clearly doesn’t mean, “what goes up must come down”, at least not right away. We may see some near-term weakness, but probability favors a higher market looking out a few months. Of course, there were exceptions, and this could be one of those times.
There were some wicked declines of 3-8% a month out, and 5-13% a few months out. But, again, the data shows that the probability of a decline isn’t any higher than any other time despite the market looking extremely overbought and ‘primed for a short’.
When the time comes for a big decline, it is more likely to happen after a period of moderate weakness, rather than a drop out of the sky event. Risks are certainly rising as the market ‘goes off the rails’, but momentum may beget more momentum before a meaningful top develops. Should we see signs of this happening, we’ll be sure to provide our insights. Stay tuned…
Trader Resources
Whether you are a new or experienced trader, we have several resources available to help you; indicator for tracking trader sentiment, quarterly trading forecasts, analytical and educational webinars held daily, trading guides to help you improve trading performance, and one specifically for those who are new to forex.
---Written by Paul Robinson, Market Analyst
To receive Paul’s analysis directly via email, please SIGN UP HERE
You can follow Paul on Twitter at @PaulRobinsonFX


