


What’s inside:
- S&P 500 consolidating, pulling back into confluence of support
- Overall market conditions and year-end favor closing at or near a record
- A decline below 2652 seen as unlikely at this time if first line of support doesn’t hold
See the IG Client Sentiment page to find out what retail traders are doing and what it could mean for the S&P 500 and other key markets.
In last week’s S&P 500 commentary this was the question asked as the market started to dip: “Will buyers snatch up stocks so quickly on weakness this time around?” Our response to the question: “Recent history says, yes, that in all likelihood we will see a dip bought, and probably sooner rather than later.” Now, it wasn’t expected that after two small down days we would see a new record high the next day, but in the current market environment of ‘single-digit-day bear markets’, it also wasn’t surprising.
Seasonality will remain a tailwind until at least the calendar flips, and it goes without saying, but the trend is also on buyers’ side. Next week, markets are closed on Monday for Christmas, and the rest of the week, barring a major headline, will bring thinner trading conditions. It doesn’t mean we can sit back and abandon risk controls, but expectations for a healthy trading environment will certainly be dialed down.
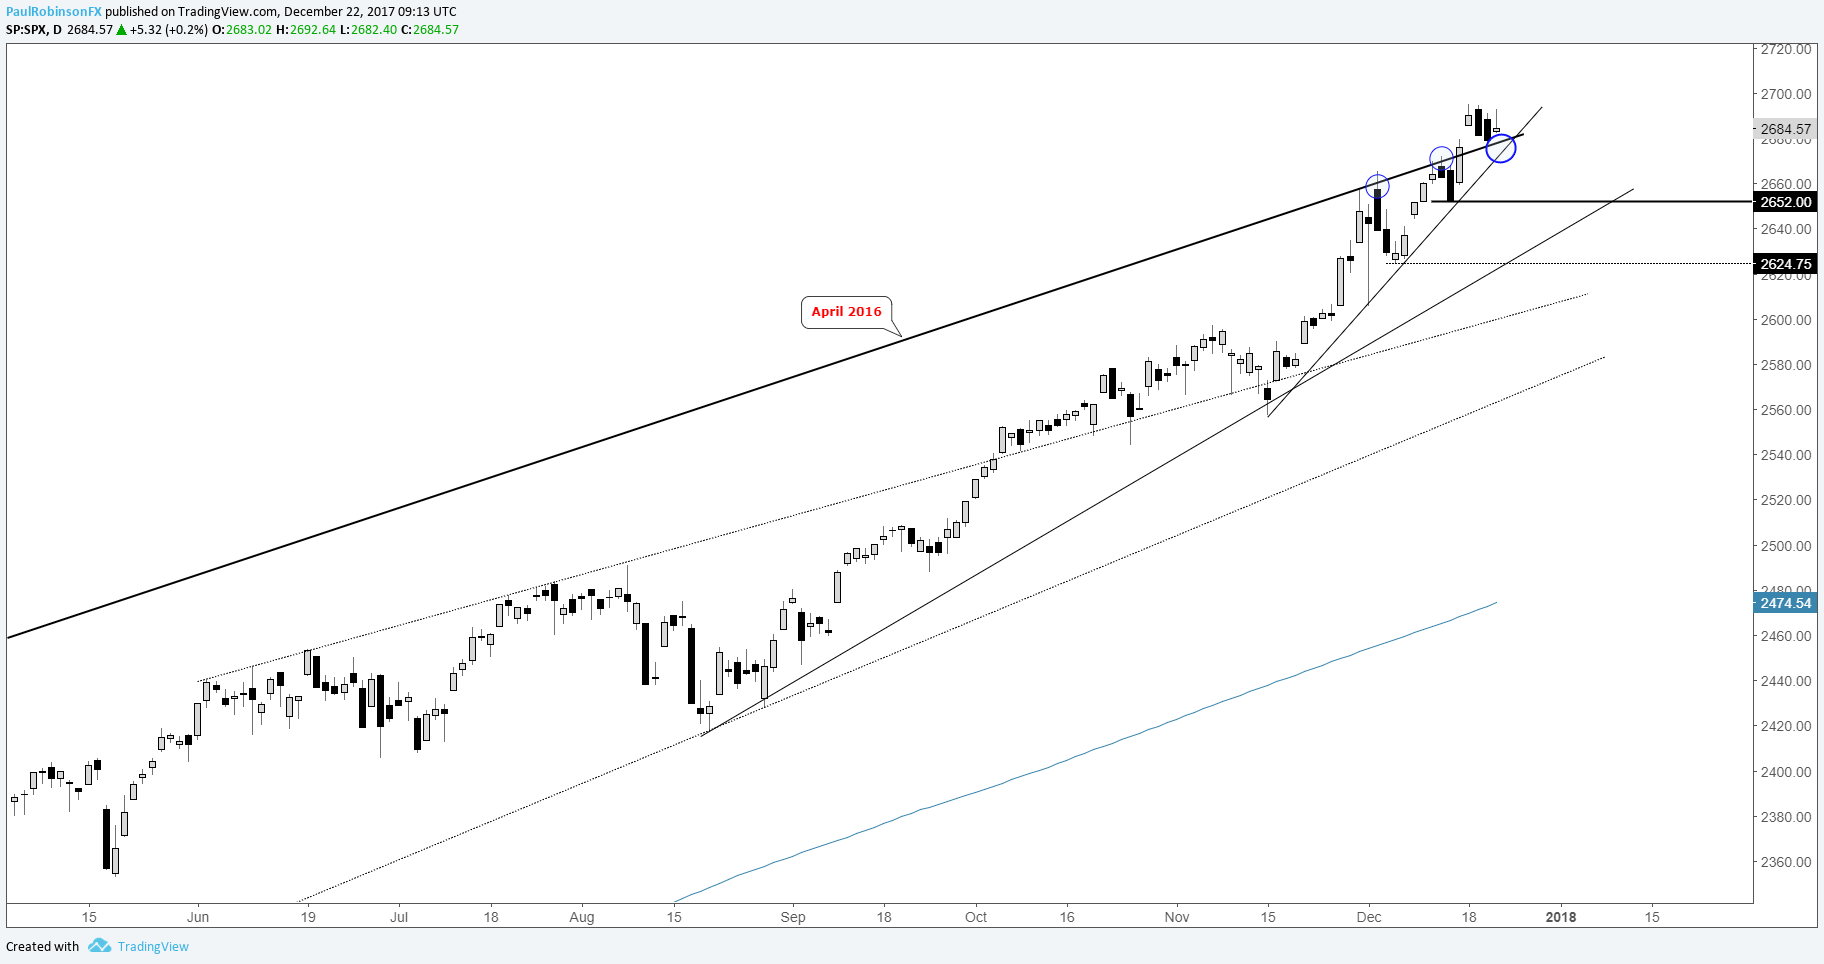
The S&P 500 is very near a confluence of support in the form of a pair of lines from varying angles. The first line extends over from the peak set in April 2016 across the March high. This slope had short-term implications (on 12/4, 12/13) before the market broke on through. Old resistance is now new support. The second line of support is rising up off of the November low. The intersection between the two lines is in the vicinity of 2478/74. A hold of these levels on a daily closing basis will likely bring new highs into focus. Should this first area of support break, again giving strong favorable market conditions the benefit of the doubt, it seems unlikely we will see a lower-low below 2652 before firming up.
Start expanding your knowledge base today with Market Forecasts and Educational Guides.
S&P 500: Daily
---Written by Paul Robinson, Market Analyst
To receive Paul’s analysis directly via email, please SIGN UP HERE
You can follow Paul on Twitter at @PaulRobinsonFX


