


What’s inside:
- S&P 500 sprint to new record highs found resistance at upper parallel from 2016
- Monday’s ‘gap-n-trap’ off resistance after volatile session shifts focus lower
- Looking for a pullback to continue in this sequence towards 2600
Start boosting your knowledge base today with DailyFX Trading Guides
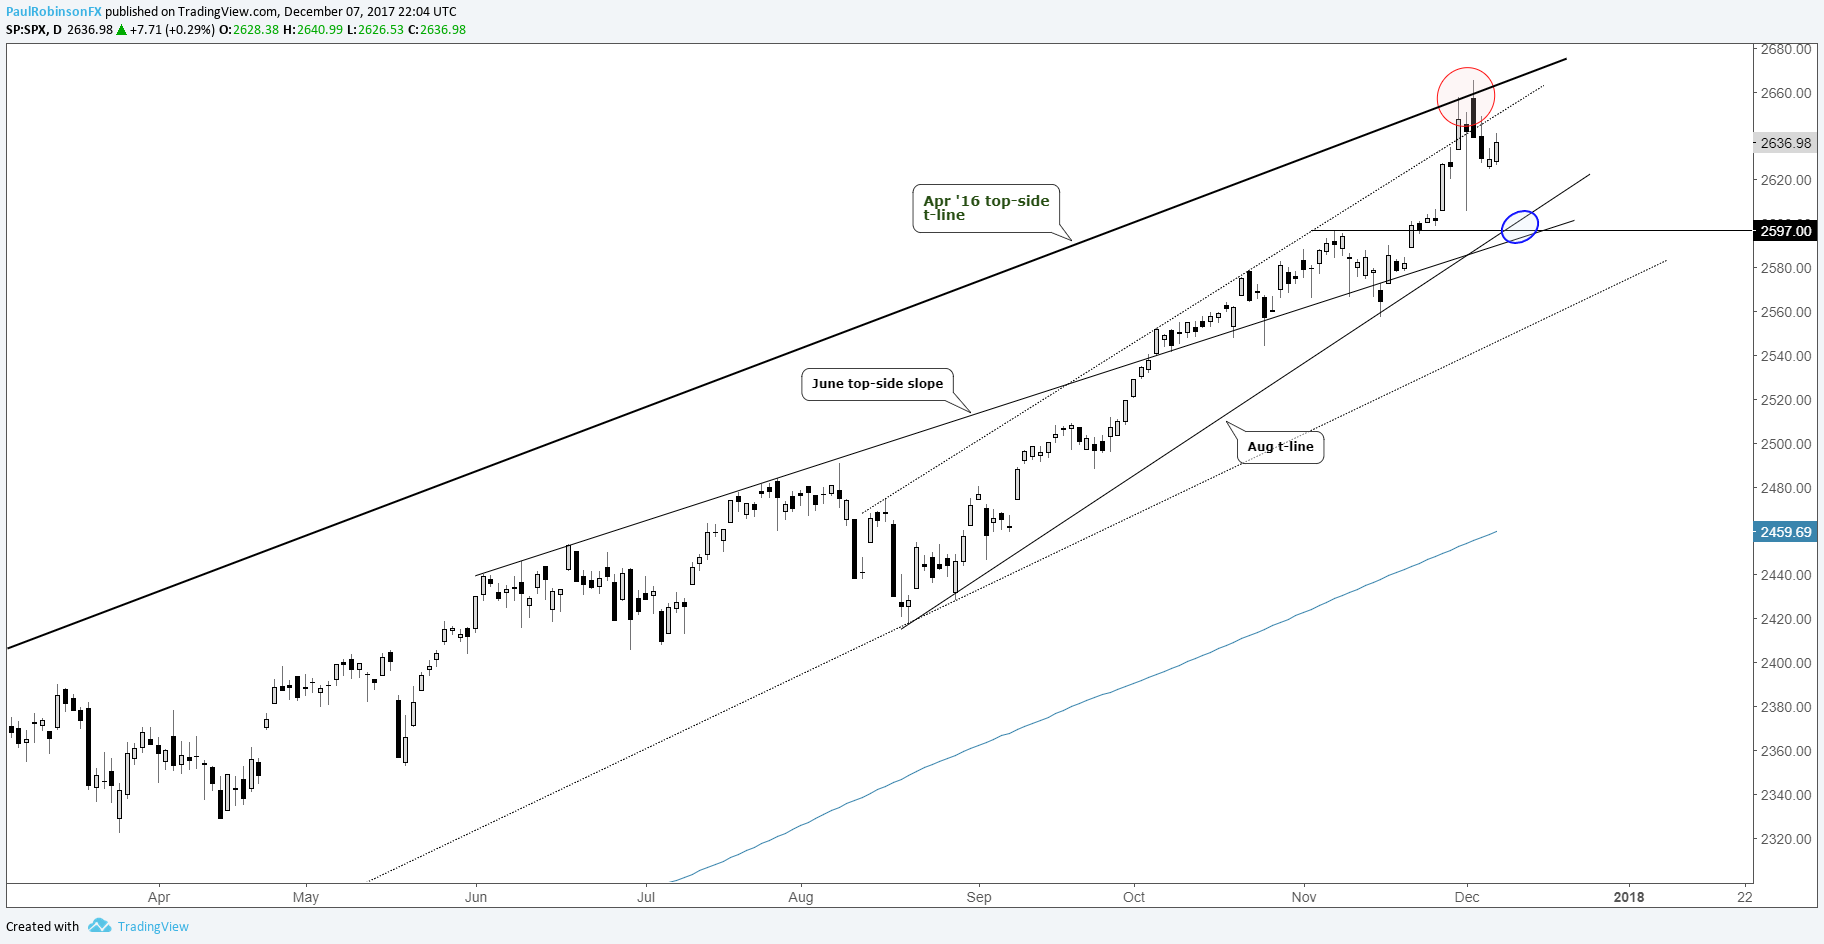
The recent sprint to new record highs in the S&P 500 brought it to a top-side trend-line starting back at the peak in April 2016 which crosses over the March high and over the point where the market stalled late last week into Monday. The gap and intra-day reversal (aka ‘gap-n-trap’) to start the week gave indication that the ‘blow-off’ period we were discussing last week had likely, at the least, come to a pause, if not signaling an outright decline to take place next.
Market participants have been conditioned over time to ‘buy-the-dip’, every little dip. So far, that has been the right play, and indeed with seasonality favorable we could see the dip bought again. But the optimal spot may not come until we see overbought conditions alleviated a bit more, either through time, price, or both. Even if the S&P 500 were to rise back up towards Monday’s high, the trend-line which put the stop on it this week could do-so once again.
Barring a complete resurgence to new highs and strong close above the upper trend-line, a drop down into a sizable area of support may be just around the corner. There is confluence between varying angles of support surrounding 2600 (+/- 5 points). The slope from June (which has several points of influence), the August trend-line, and swing-high created in November all run together in the same general vicinity.
S&P 500: Daily
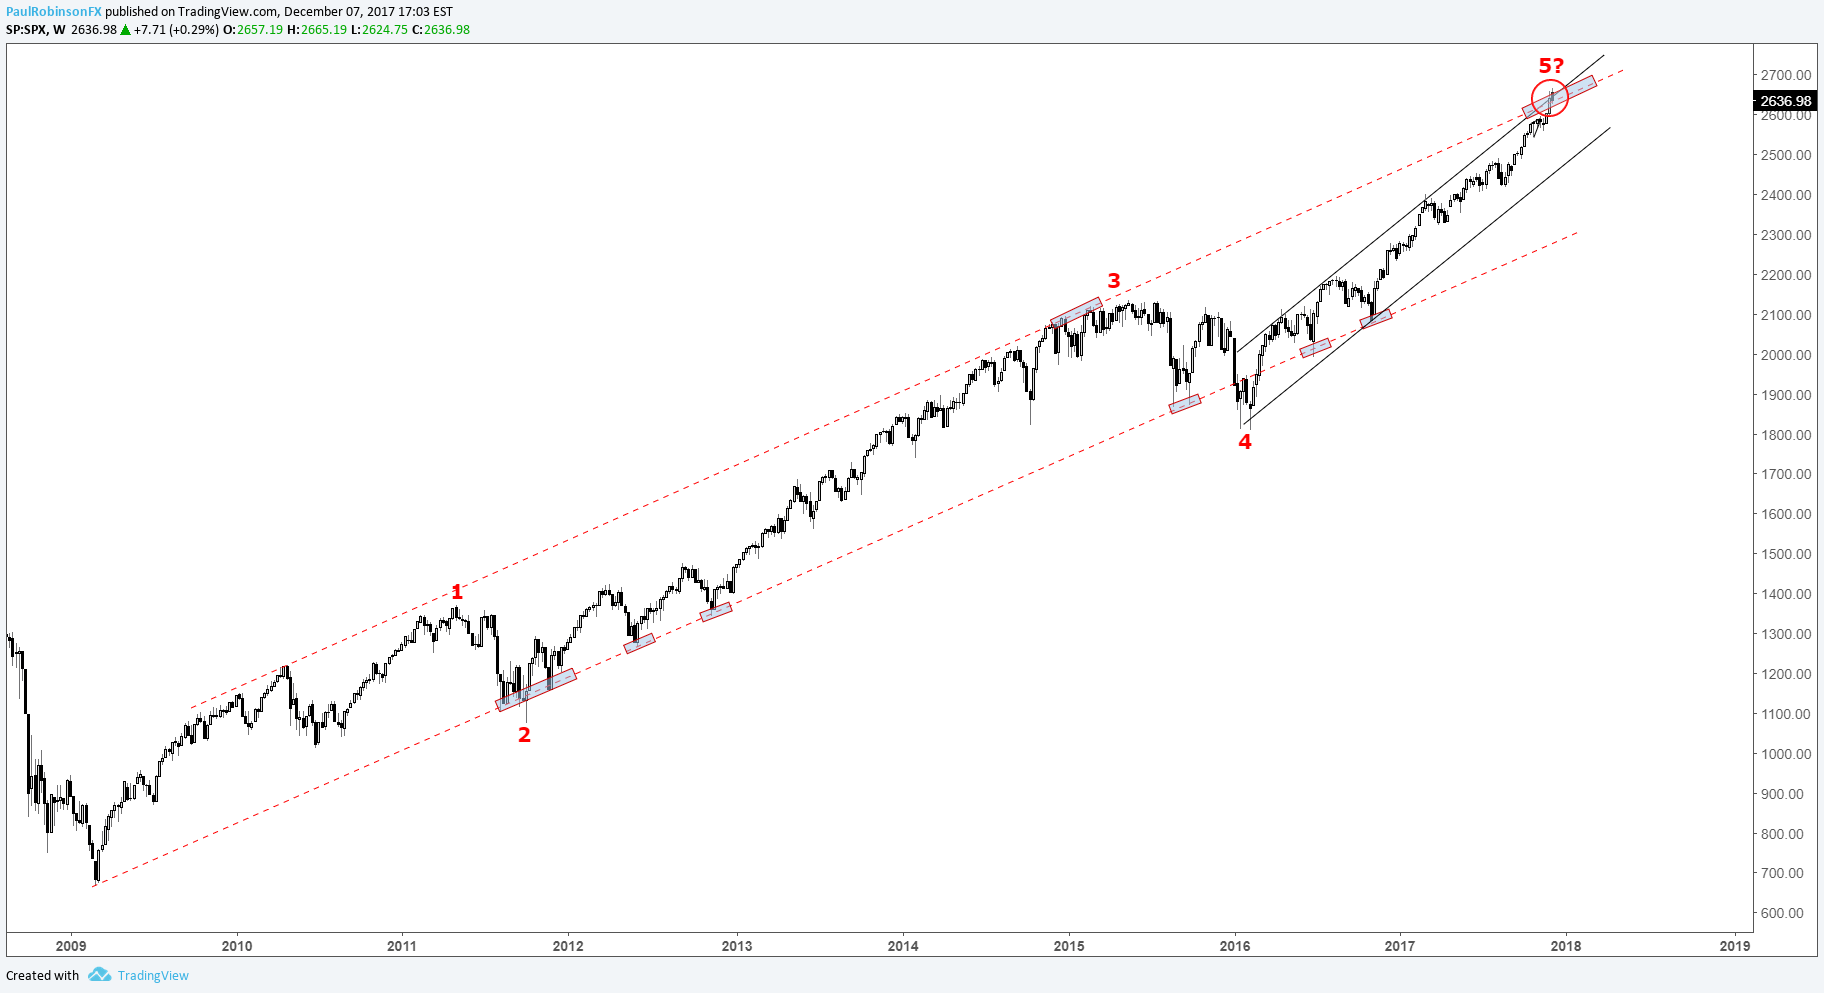
This was brought up last week, but it’s worth mentioning again. The area we are at now is quite important from a long-term standpoint. There is an upper parallel starting all the way back in 2009 that may have a material influence on the market as the calendar flips to 2018. We may be nearing the end of a ‘wave-5’ high. For more on this, check out this piece.
To learn more about trading psychology, check out this guide on Building Confidence in Trading
S&P 500: Weekly
Want to hear Paul’s analysis live? See the Webinar Calendar for details and a schedule of all upcoming live events.
---Written by Paul Robinson, Market Analyst
You can receive Paul’s analysis directly via email by signing up here.
You can follow Paul on Twitter at @PaulRobinonFX.


