


What’s inside:
- S&P 500 roars to new record highs, does so at a vertical pace this week
- CBOE Volatility Index (VIX) spiked yesterday as the rise accelerated, indicates instability
- Weakness looks likely in the days ahead as unwinding of ‘euphoric’ buying unfolds
Start boosting your knowledge base today with DailyFX Trading Guides.
Last week, we were looking for a ‘dip-trip’ opportunity which could present ‘would-be’ longs with an opportunity to join the trend. As it turns out, the market had in mind a different idea. No dip, just rip. Which brings us to where we are now, the market standing straight up in the air. Yesterday, the price action got a little wild (not as wild as Bitcoin, but wild for this low-volatility environment), and options traders didn’t fail to take notice.
The CBOE Volatility Index (VIX), also known as a ‘fear barometer’ due to it typically rising in a down tape as market participants buy puts for protection, rose as much as 12% intra-day with the S&P 500 up well over 1%. Not an everyday occurrence to see implied volatility rise so vigorously on a big up day. As the market retreated in the afternoon so did the VIX. This kind of unusual behavior smacks of price instability.
The S&P overshot the top-side parallel running over tops since August, but closed below another longer-term one extending higher since April 2016. Price instability coupled with resistance points to significantly heightened risk for a material pullback to develop in the short-term. On the downside, a decline back towards 2600 would bring into play some decent support levels which, depending on timing, could be in confluence with one another.
Seasonality remains favorable in the weeks ahead, so perhaps we don’t see anything too aggressive, and if support levels below are achieved and hold we may still get that ‘dip-trip’ opportunity into year-end. In any case, short-term volatility looks set to rise a bit, which is almost always a good thing for traders.
S&P 500: Daily
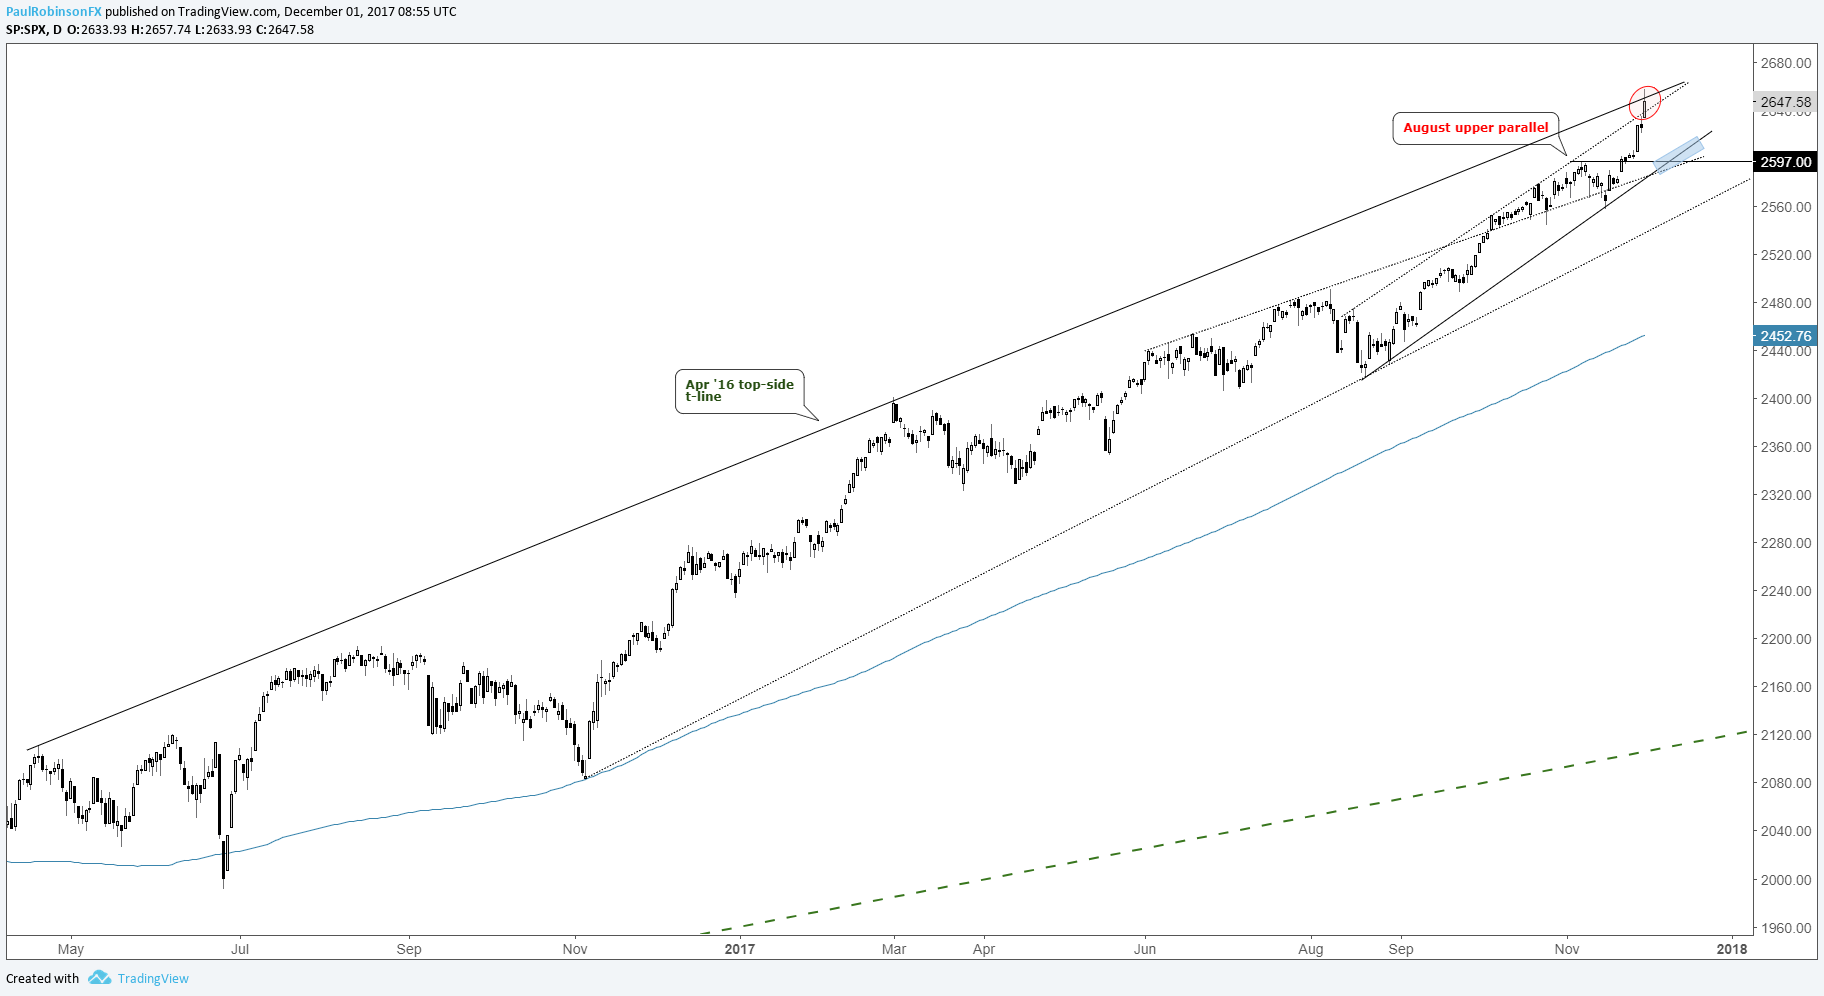
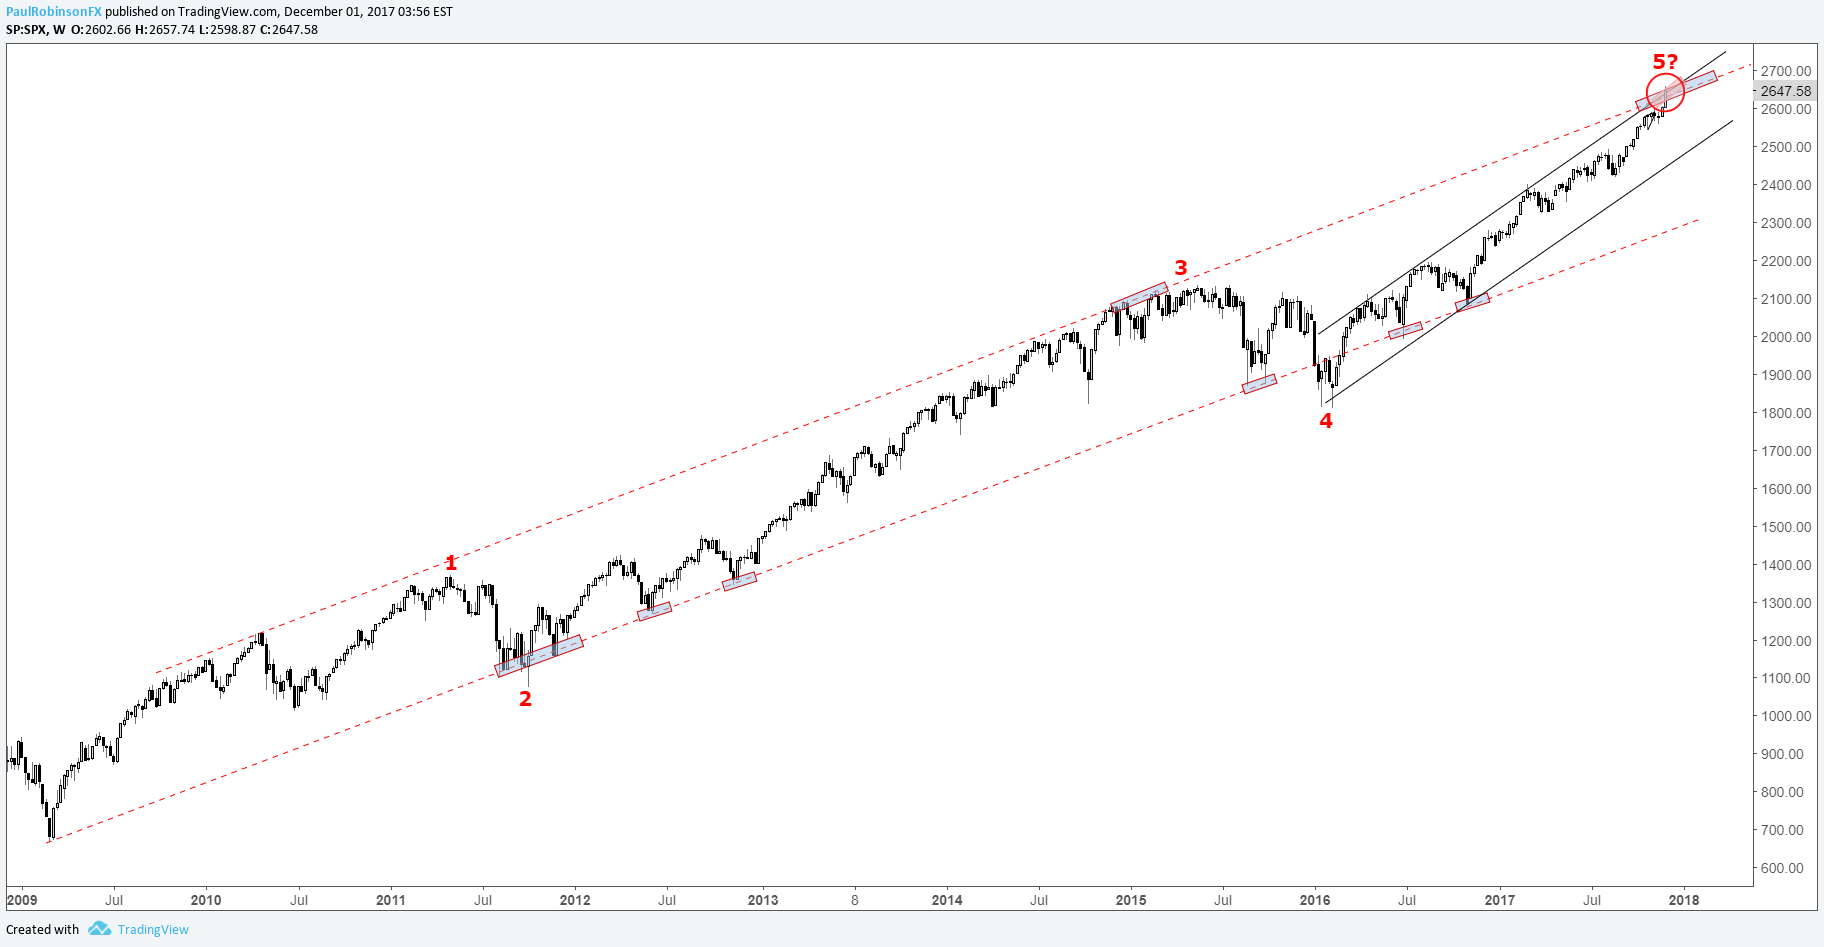
Longer-term we are at a very interesting juncture as well. Recently we noted that the area around 2625/50 (slightly exceeded so far) could rustle up some interesting price action (which we are starting to see) due to an even more significant top-side slope than the aforementioned lines also in the current vicinity. For more on the chart below, check out this commentary.
Check out this guide for tips on Building Confidence in Trading.
S&P 500: Weekly
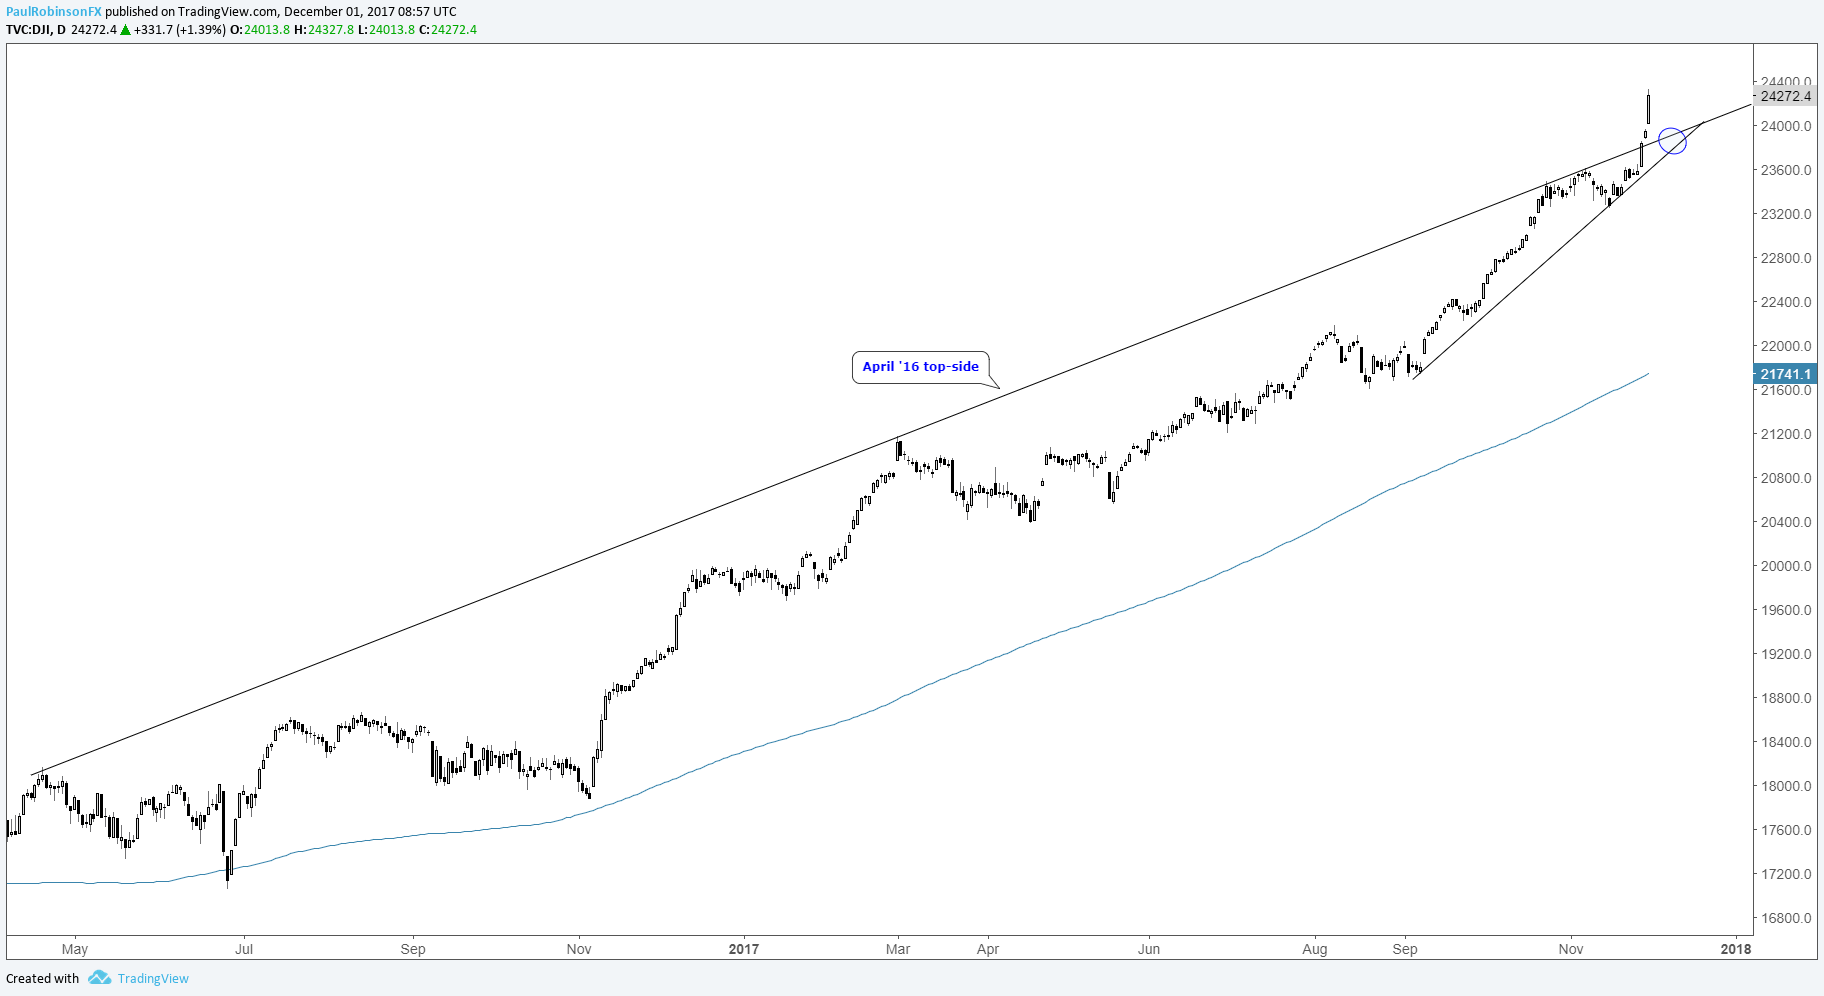
The Dow Jones presents less clarity, with it lacking the overhead slopes that the S&P 500 has as hurdles, but if the S&P undergoes a material pullback it won’t go untouched. The past few days have been the most insane for this index (Nasdaq 100 is actually down over the past week), and looks poised for a pullback. The equivalent April 2016 top-side trend-line was exceed during the past couple of sessions and that line along with the trend-line rising up from September will be viewed as first up in terms of support.
Dow: Daily
Want to hear Paul’s analysis live? See the Webinar Calendar for details and a schedule of all upcoming live events.
---Written by Paul Robinson, Market Analyst
You can receive Paul’s analysis directly via email by signing up here.
You can follow Paul on Twitter at @PaulRobinonFX.


