


What’s inside:
- S&P 500 continues to hold steady on June slope, keeping the market pointed higher
- Bearish pattern beginning to come into view on the hourly chart
- Formation may not lead to a sharp decline, but at least provide traders with a little volatility
Check out the DailyFX Quarterly Forecasts to find out where our analysts see global stock markets ending the year.
Last week, we noted the bearish engulfing bar which took shape in the S&P 500 on Monday and its potentially bearish implications. Which proved to be correct…for an entire day-and-a-half. Broadly speaking, it has paid those who just follow along with the trend, because pullbacks with any meaning have become non-existent. The upward grind has generally been unkind to the short-term trader in terms of providing volatility, and that very well may continue on through the end of the year.
The once top-side June trend-line has become a solid source of support since crossing it a month-ago. Last week it was broken by a fairly wide margin on an intra-day basis, but the market still managed to close above. Yesterday, we saw another successful hold on an intra-day dip. We will continue use this line as a steadfast line of support for as long as it holds.
S&P 500: Daily
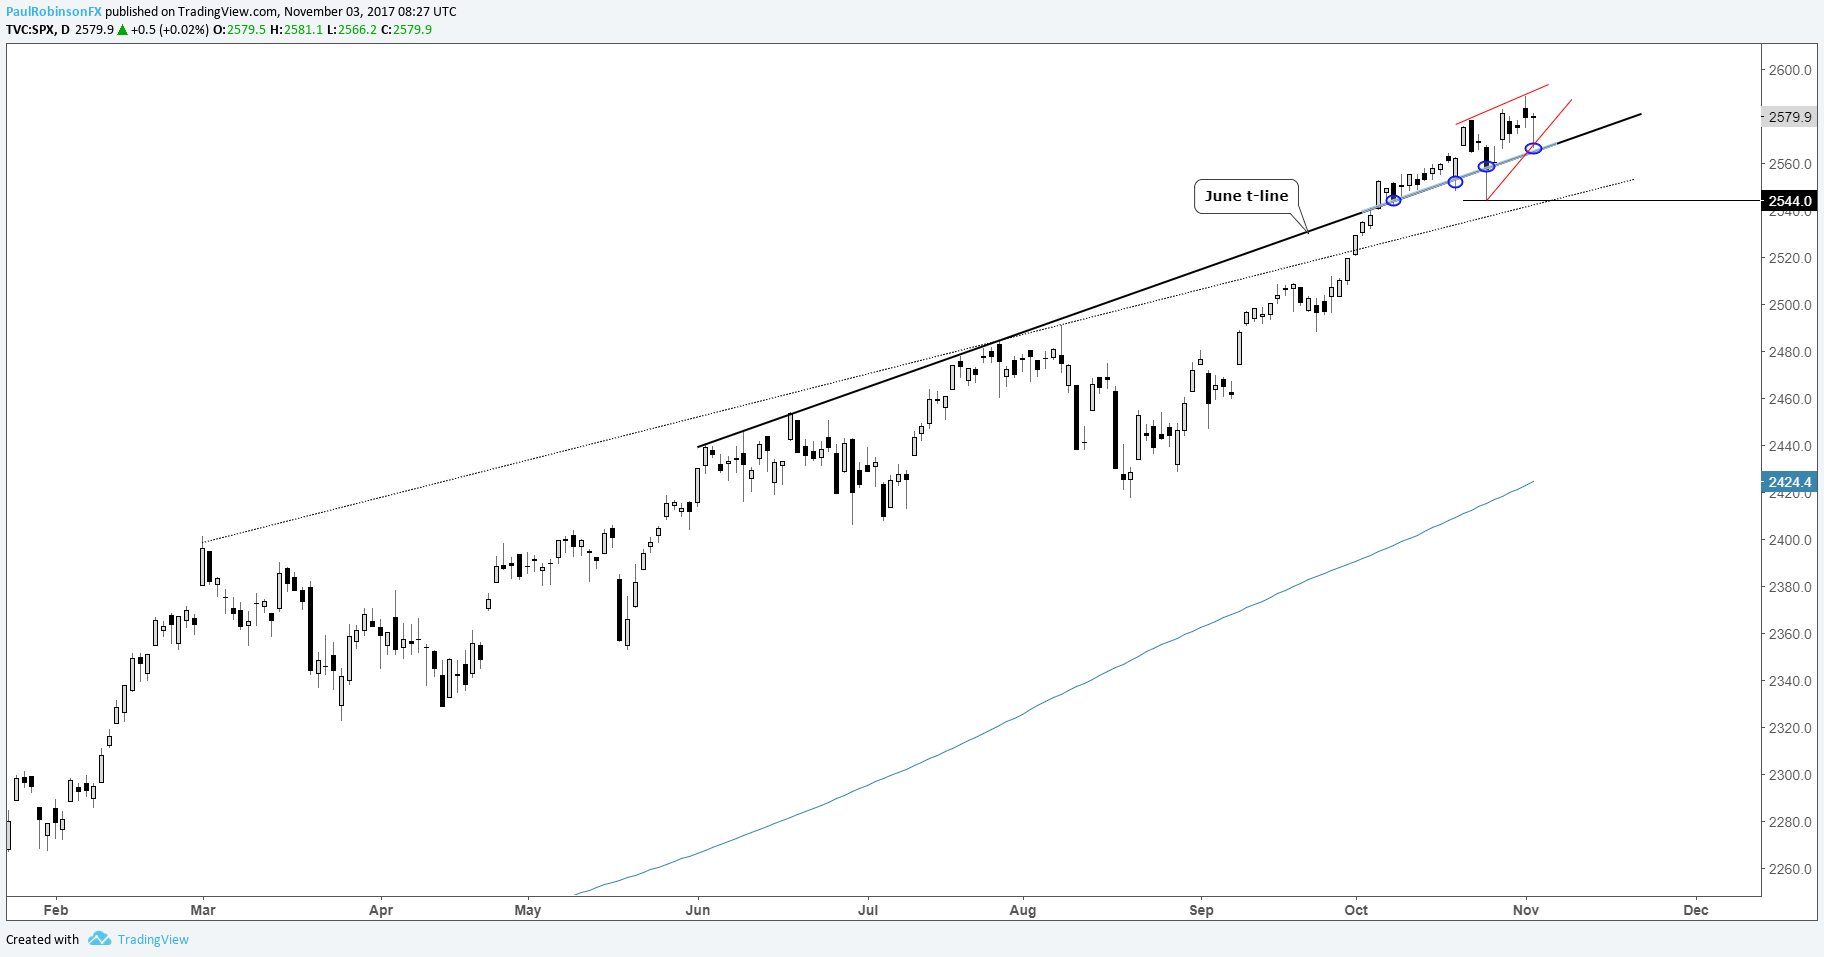
For as long as it holds…
There is one bearish possibility beginning to show its face. It’s one which we talked about yesterday in a webinar on classic technical patterns. It will take a little more time, like maybe Monday or Tuesday, before its fully matured, but a rising wedge is coming into view. Its development is coming after an extended move and the narrowing upward price swings may be close to corralling the bulls over the edge. A break would of course immediately bring into play the June slope, but with these patterns often leading to swift reversals it may be the first time in over a month it doesn’t hold. The target would be support around 2544/40, and that may be about all we get…it’s a bull market, after all.
Want to hear Paul’s analysis live? See the Webinar Calendar for details and a schedule of all upcoming live events.
Hourly

Bottom line: It’s paid to be a bull, but there is potential for the short-term trader to take a bite out of the market from the short-side if the current sequence matures into a rising wedge and breaks the lower trend-line. This would at least bring about a spat of volatility, and at this point, any volatility is welcomed. It may also lead to the next good ‘dip-trip’ opportunity for longs.
---Written by Paul Robinson, Market Analyst
You can receive Paul’s analysis directly via email by signing up here.
You can follow Paul on Twitter at @PaulRobinonFX.


