


What’s inside:
- S&P 500 trend remains broadly higher
- Short-term pattern could lend to decline to support
- Scenarios and price levels outlined
Find out in our Q3 Forecast what’s driving the S&P 500 this quarter.
On Thursday, we discussed a couple of ways to handle the current trading environment with the S&P 500 effectively ‘suspended in air’. With volatility low and a summer trading environment upon us as August gets started we have to be especially selective in how we maneuver in the indices.
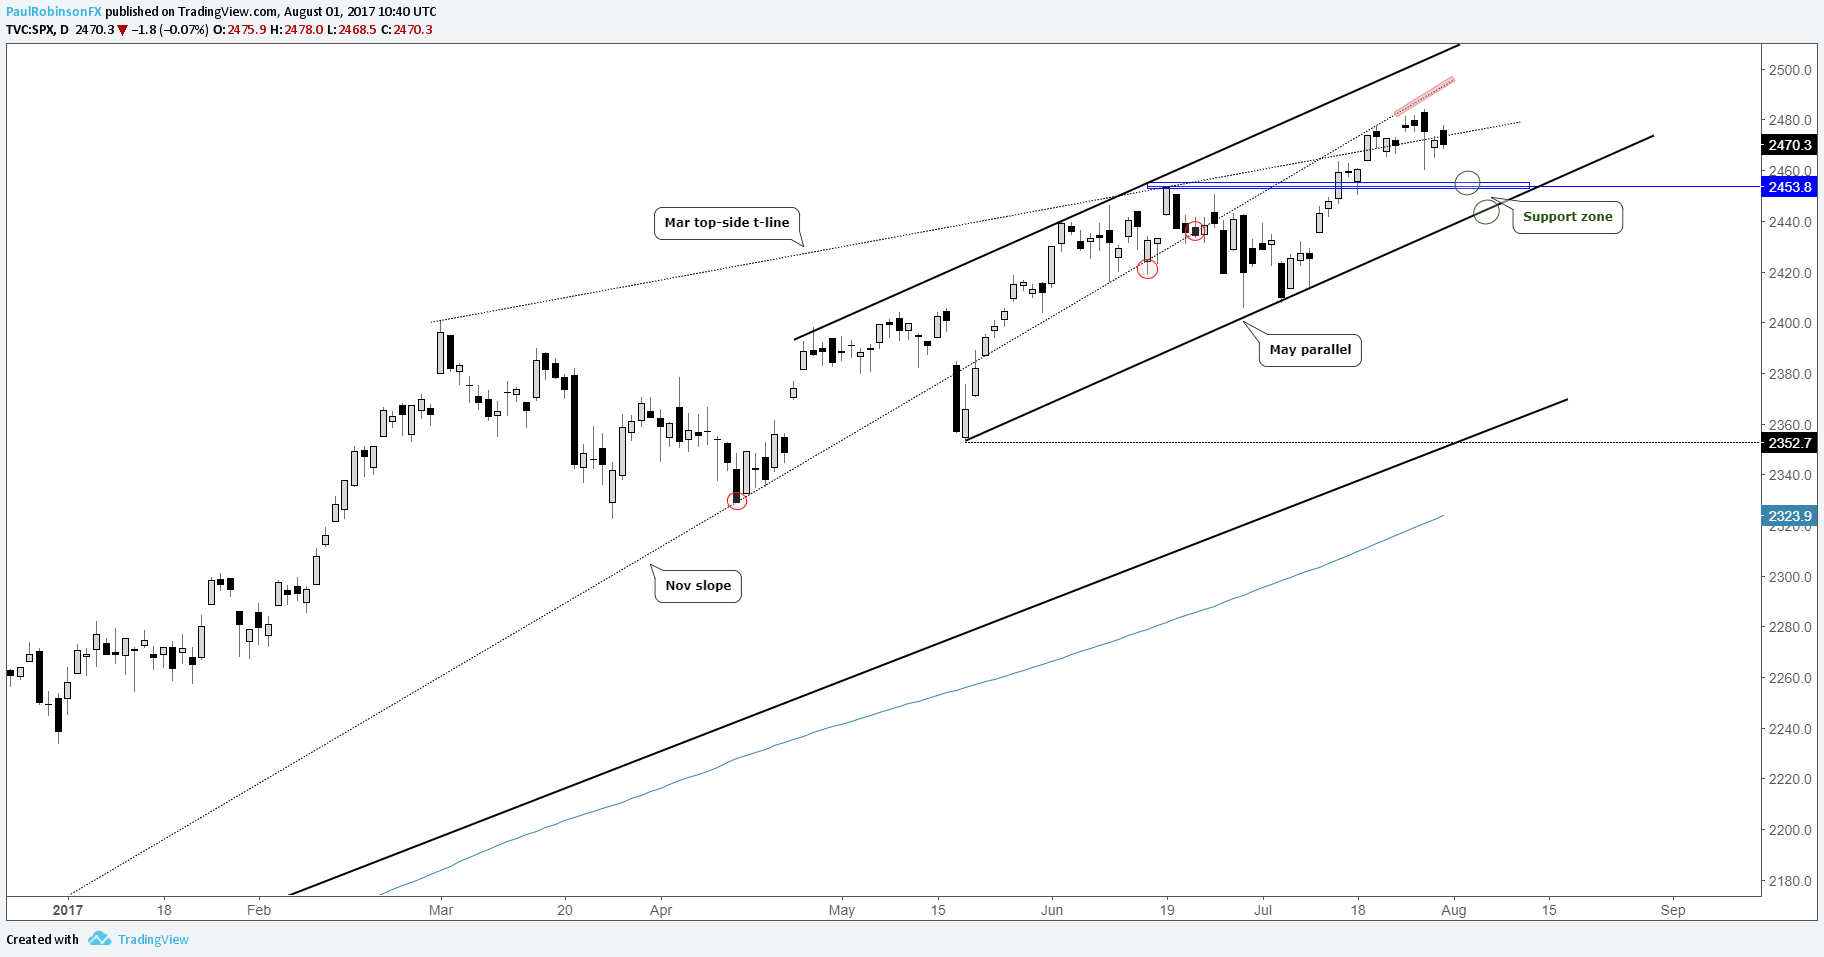
Looking at the daily chart the broader trend higher is unquestionably intact and suggests the S&P 500 will trade to higher grounds in the absence of a catalyst which will upset the market. And if this is the case the sequence of choppy trading followed by surges to new highs will likely be the course to follow. One of the scenarios highlighted last week was for a minor pullback to the June high at 2454 or the lower parallel extending higher from the May low. This stance remains in place. It may take a little time to reach support, but if it does and holds then we’ll be looking for potential dip-buying opportunities.
S&P 500: Daily
Pulling in closer to the hourly time-frame, there is a short-term pattern which may lead to a decline to those broader support levels. A small ‘head-and-shoulders’ top is developing. It’ll need to trigger soon if it is to come to fruition. Bearish patterns in strong markets are at risk of not triggering or failing altogether. Another potential issue to contend with on seeing any real follow-through is the fact that the neckline aligns roughly with the first level of support at 2354 on the daily. So, shorts will need to be mindful of this. The juice on a short-trade will most likely come on a break of the neckline and 2354. This will leave about 10-15 handles until we reach the lower parallel on the daily. It’s not a large amount of profit potential, but could give the very short-term trader something to work with from the short-side.
For those who have no interest in making bearish bets, waiting for a pullback to support or further consolidation is a prudent approach. The short-term H&S pattern may be lead to seeing a test of support and potentially better entries for would-be longs.
See the Webinar Calendar for a full line-up of upcoming live events with DailyFX analysts.
Hourly

---Written by Paul Robinson, Market Analyst
You can receive Paul’s analysis directly via email by signing up here.
You can follow Paul on Twitter at @PaulRobinonFX.


