


What’s inside:
- U.S. markets in ‘blow-off’ stage
- No interest in getting blown away short, but buying here looks risky
- Levels under consideration
Looking for trading ideas? See our Trading Guides.
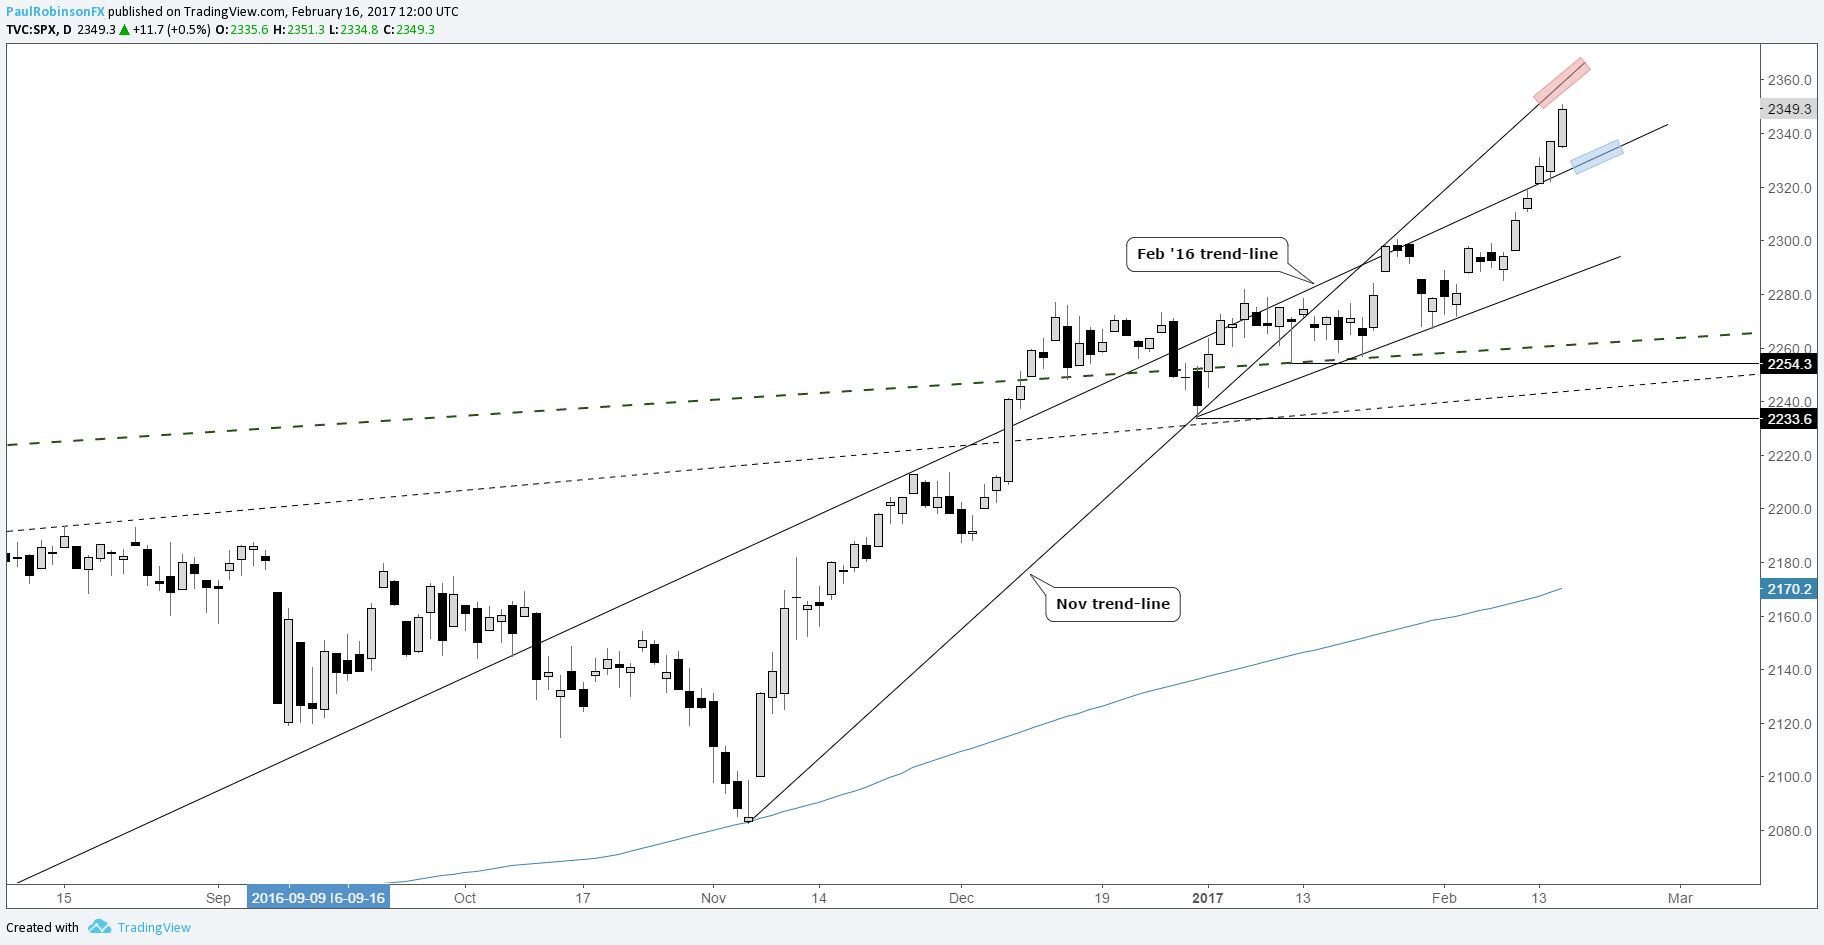
To start the week, the S&P 500 was testing the bottom-side of a trend-line running back to the Feb lows from last year; that line in a hurry become ‘right here’ to ‘down there’. The recent advance after a painful chop through much of December and January is looking a lot like a ‘blow-off’ top in progress. We’re not quite in a parabolic state, but it wouldn’t take much more of a rally to put it there. With that said, it’s hard to say when we will see a meaningful, trade-able top, but it’s possibly on its way to a theatre near you soon. The time-frame of a ‘blow-off’ isn’t isolated to one; there are short-term exhaustions, then macro. For now, we are mostly concerning ourselves with the short-term.
Being a ‘Tommy Top Picker’ isn’t fun and often times expensive, so we’ll wait for momentum to turn on the longs before digging in from the short-side. Buying at this juncture holds poor risk/reward, unless you are buying intra-day dips – which have been fruitful with their very shallow occurrences.
Looking upward, where could the market stall? Perhaps the under-side of the November trend-line around the 2060ish mark and climbing. But, again, these market melt-ups can be vicious, and until we see good price action indicating this move has run its full course we have no interest in being a hero here. On any decline from here we will look to the Feb ’16 trend-line as the first area of potential support, currently around 2328 and climbing.
S&P 500: Daily
Created with TradingView
See the Webinar Calendar for a schedule of upcoming live events with DailyFX analysts.
---Written by Paul Robinson, Market Analyst
You can receive Paul’s analysis directly via email by signing up here.
You can follow Paul on Twitter at @PaulRobinonFX.


