


What’s inside:
- S&P 500 bullish pattern looking increasingly fragile
- Global risk sentiment moving in reverse
- Key support and resistance levels outlined
See the Webinar Calendar for a schedule of upcoming live events.
On Friday, we took a look at the S&P 500 and noted the bullish reversal on Thursday after it made an attempt to break the November trend-line. Price action since mid-December has been taking on the shape of a continuation-style inverse head-and-shoulders, with the Thursday key reversal bar helping the cause. It’s not the sturdiest of patterns, but still one on the table, as stated the other day, should we see a close above the neckline into new record territory beyond the 1/6 high at 2282.
However, looking around at how a couple of key global markets are rolling over, global risk sentiment is waning, and either the confirmed break above the neckline won’t happen just yet, or at all. The Nikkei fell in overnight trade to its worst levels in over a month (making a daily lower low in the process), while the DAX is now trading in negative territory for the month below the bottom of its recent consolidation. We’re keeping an eye on the Shanghai Composite, too, as it flirts with a breakdown below a one-year trend-line. China concerns have been on the back-burner for a while, however, if stocks begin to fall sharply that could quickly change.
Should we begin to see weakness set into the S&P 500, we’ve got our eyes on the area around 2050. The bullish key reversal event on Thursday came right around a long-term top-side trend-line running over peaks in 2007 and 2015. A strong daily close below the Thursday low (2254) and the 12/14 low (2248, the first hold of the ‘07/’15 t-line) would go a long way towards invalidating the possibility of the inverse H&S coming to fruition. Also, a break below 2248 would clearly put the market below the before-mentioned trend-line which has been in play as support, as evidenced by its ability to halt two pullbacks in the past month (most notably, last week).
The outlook for longs is getting cloudier, while increasing clarity could be on the horizon for shorts. However, we still need to see one of a couple of things play out – either a bullish neckline break, or break below key support – before we can confidently move into the bull or bear camp.
S&P 500: Daily
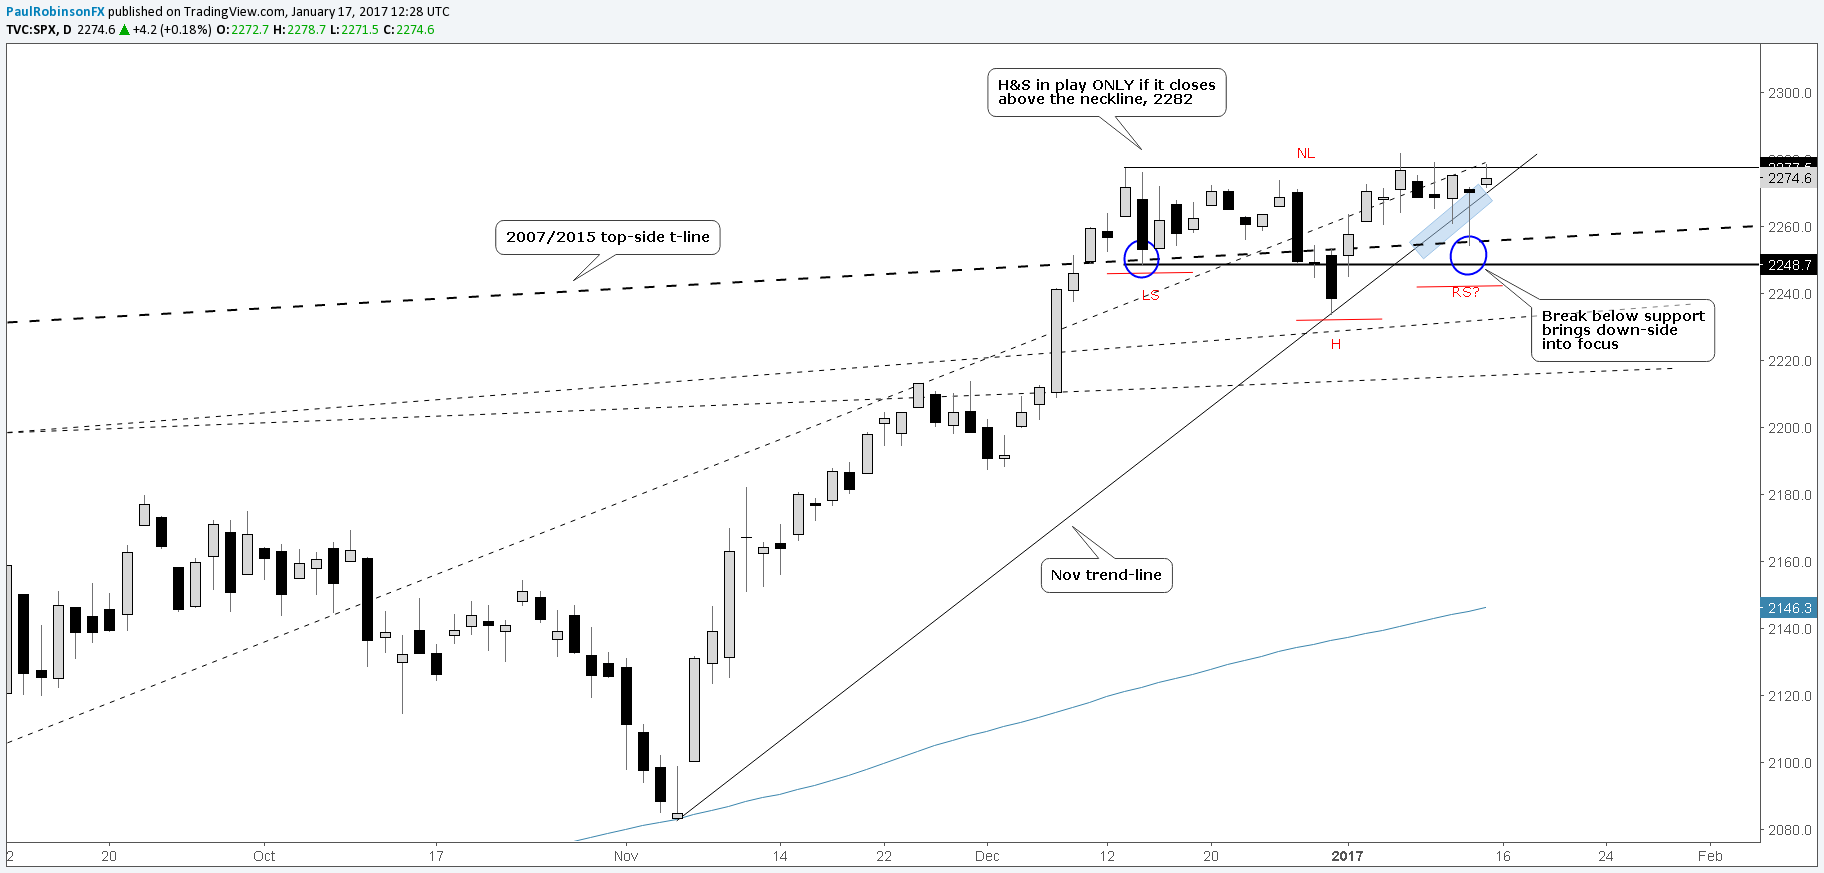
Created with Tradingview
Looking for trading ideas? See our Trading Guides page.
---Written by Paul Robinson, Market Analyst
You can receive Paul’s analysis directly via email by signing up here.
You can follow Paul on Twitter at @PaulRobinonFX.


