


What’s inside:
- The S&P 500 is looking to holding first eyed support zone at this time
- How the market responds here could be a good tell for the short-term
- A break below and failure to rally needed to turn bearish
For educational material and forecasts, see our trading guides.
When we last discussed the S&P 500 on Thursday, we said the reversal day on Wednesday put support levels not far below at risk. The initial zone of support we are eyeing lies between 2194 and 2188, which held the last two days to end last week (Thursday low was 2187, closed at 2191).
We are taking interest in how the market treats this zone of support. The low on Thursday at 2187 will be the first short-term level to keep an eye on. As long as the S&P holds above it will still maintain a semi-constructive stance. A strong push higher from here would indicate another leg up could be underway, or a consolidation period at the least as long as the floor is held.
A break below 2187 opens up a path for further weakness towards levels not far below in the 2180/69 area. It will be difficult to become outright bearish until we see a break below support and a subsequent failure to regain noted levels. This makes the current landscape neutral to semi-bullish. End of the year forces (will there be a Santa sighting?) help support a generally constructive view as well.
S&P 500: Daily
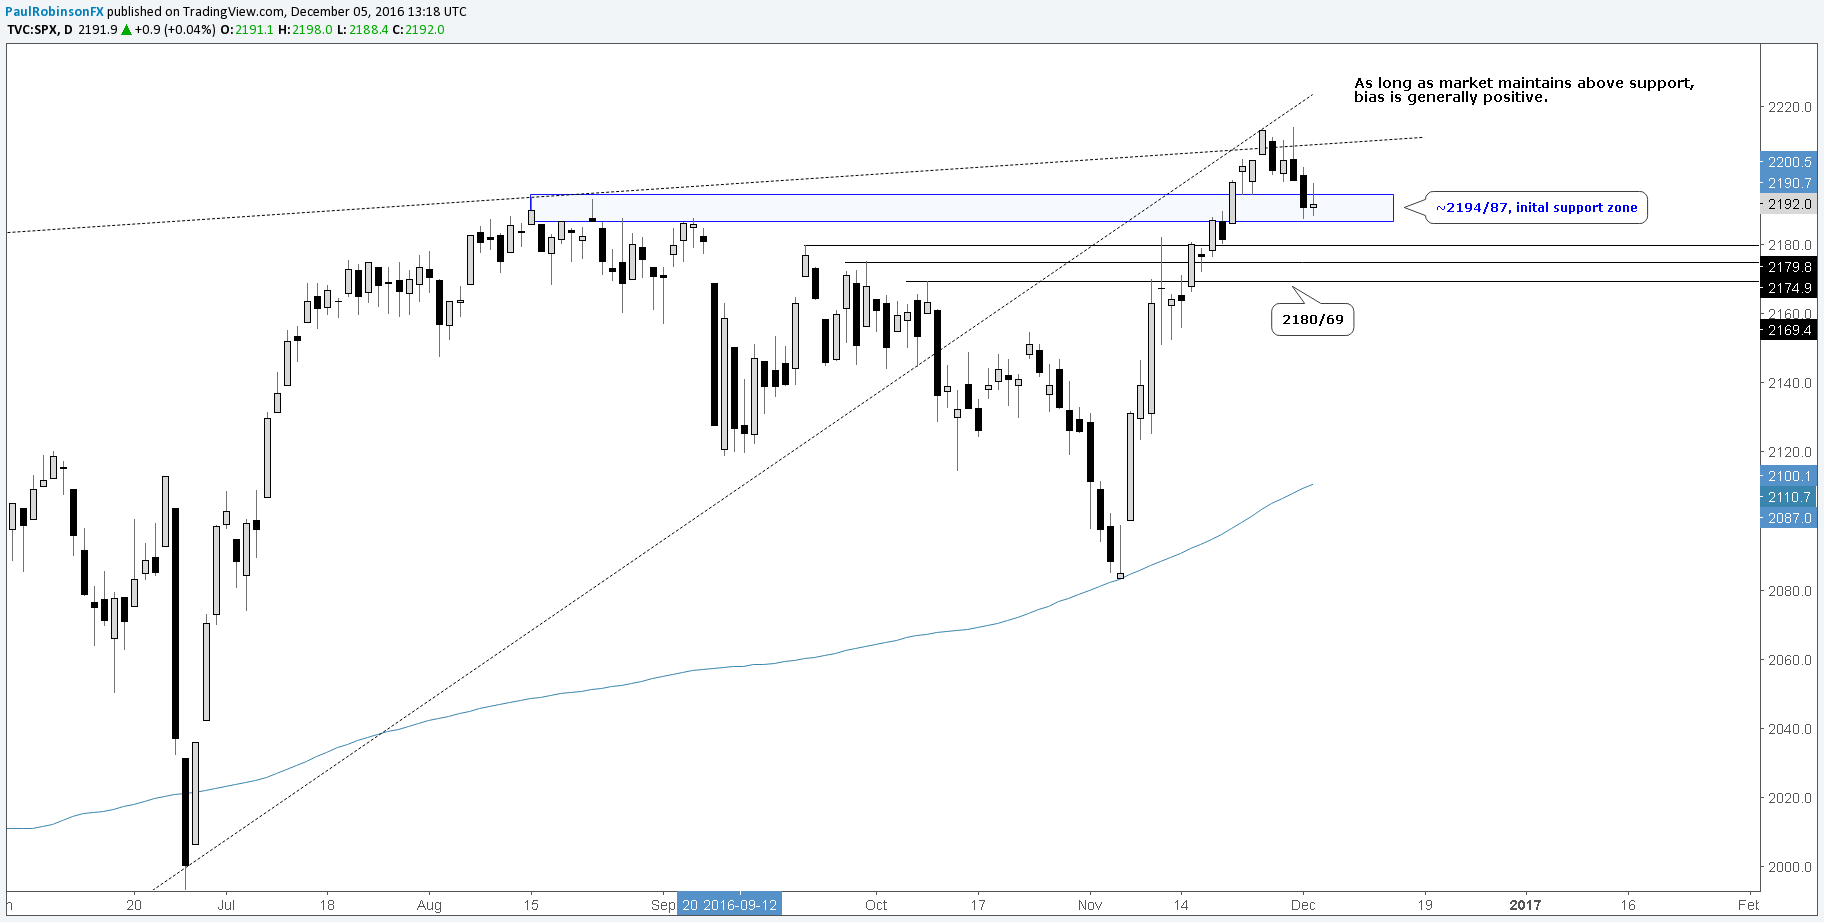
Created with Tradingview
While the edge appears to still favor longs in the S&P 500, it’s worth keeping a close eye on the Nasdaq 100. Price action has not been very encouraging (it has yet to join other indices to new record highs, possible H&S top forming). And with the index dominated by some of the market’s most beloved names – Google, Facebook, Amazon, Apple, etc. – it may be a sign of deteriorating market health. It may not be anything to worry about at this very moment, but down the road it could if the 100 continues to diverge from the rest of the market.
Nasdaq 100: Daily
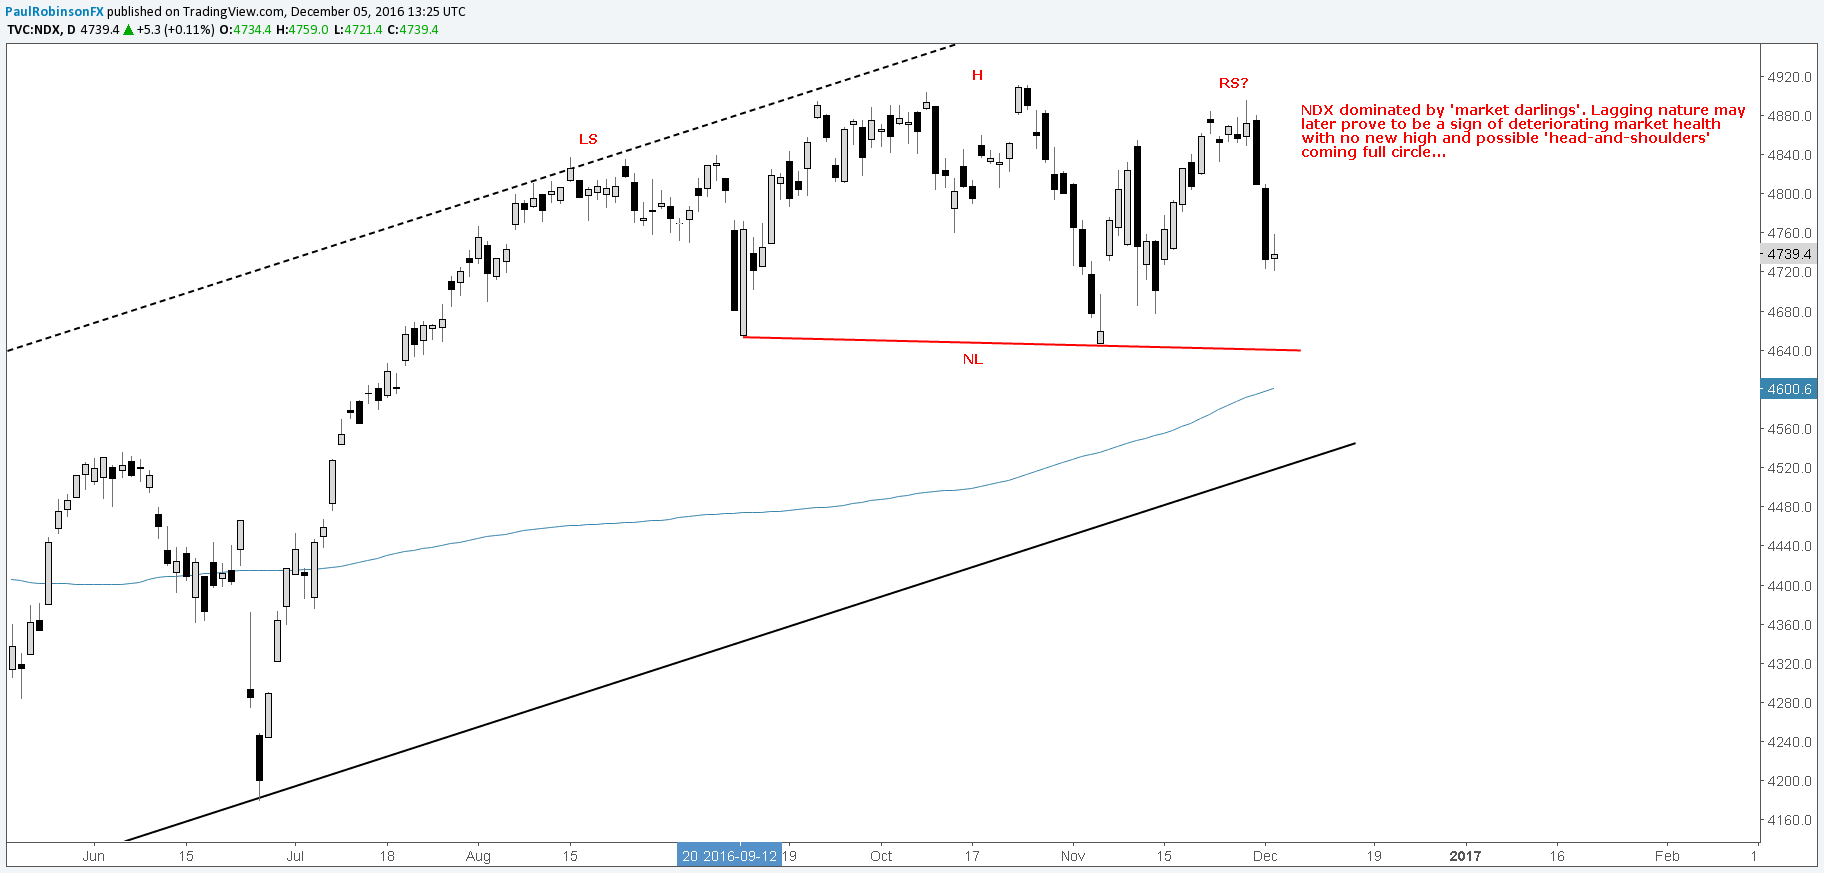
Created with Tradingview
Join me on Wednesday (12/7) at 10 GMT for a look at charts of interest in indices, FX, and commodities. For a list of live events with trading outlooks, key news coverage, and educational content, please see our webinar calendar.
---Written by Paul Robinson, Market Analyst
You can receive Paul’s analysis directly via email by signing up here.
You can follow Paul on Twitter at @PaulRobinonFX.


