


What’s inside:
- The S&P 500 turns lower shy of previous highs, exposing further downside risk
- A lot of cross-sectional lines at play here in the short-term
- Be nimble, lots of reference for short-term operations
To receive Paul's analysis directly via email, please sign up here.
Last week, when we looked at the S&P 500 it looked all but finished in its efforts to trade up to the old high around 2194, but the market had a different idea. We noted a short-term upper parallel line (in blue) which the index found resistance at and it caught our attention as something to watch should the market continue to push on higher. But as it turned out, that line of resistance turned out to be even more important than we anticipated as the S&P then sliced down through its sibling lower parallel in yesterday’s trade.
We saw a big bounce overnight (many are pointing to the Presidential debate, but I will stop there with the politics). Whatever the case, the rip pushed the S&P back into the lower-side of the broken parallel (in blue) and another angle of resistance (in green) extending back to 9/16, where sellers were found as we head into today’s session.
SPX500 1-Hour
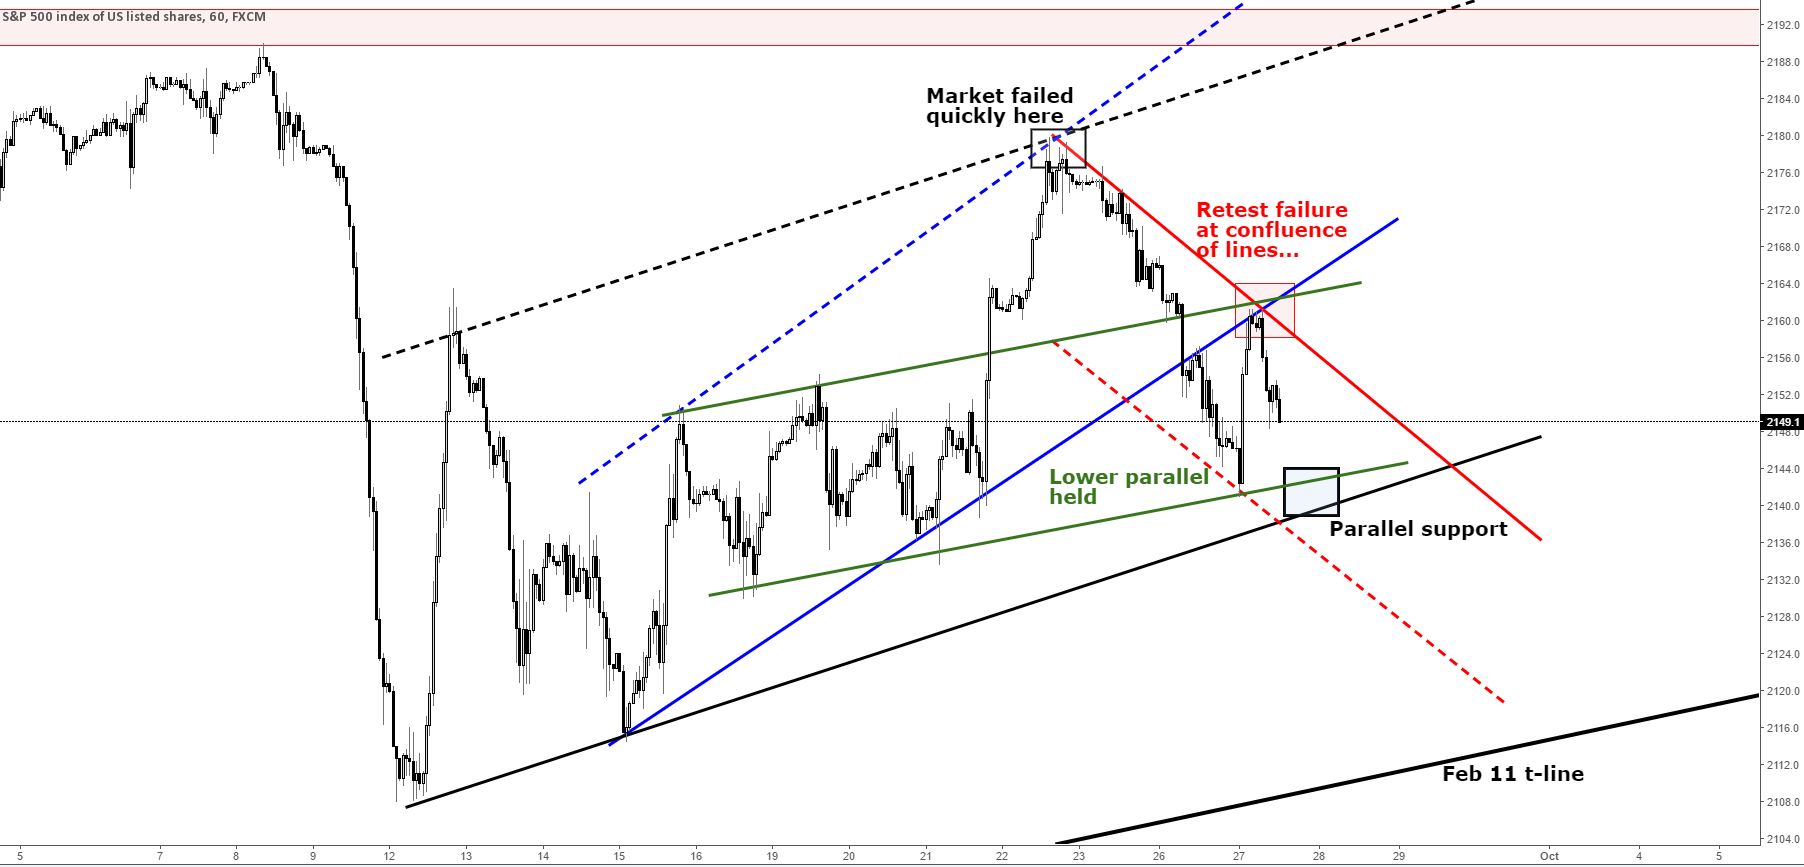
A trend-line off the recent peak (in red) is developing as well, which will be another short-term hurdle the market will need to climb to put the near-term trend in favor of longs. The trend-line off the 9/22 peak along with 2161ish is penciled in as resistance on any attempts to trade back higher.
The low yesterday came at the low-angled parallel (in green) extending back to 9/16, furthering this as a valid line of support. Below there is a lower parallel (in black) belonging to an upper line which coincided with the previously mentioned shorter-term top-side parallel. The area around 2140 will be our first zone of support. Below there, things will become interesting as the earlier month low at 2108 and trend-line off the Feb 11 low will come into focus.
The Dow, as the weaker counterpart, is already contending with the Feb 11 trend-line; pay attention to how it reacts as a break could be indicating a test and break of the same trend-line could take place in the S&P. Conversely, a strong hold and reverse may suggest this recent decline is over for now.
There are a lot of cross-sectional lines of support and resistance at play here, so being nimble will be the name of the game.
Follow market sentiment in real-time via SSI indicator.
---Written by Paul Robinson, Market Analyst
If you would like to receive Paul’s analysis directly via email, please sign up here.
You can follow Paul on Twitter at @PaulRobinsonFX.


