


What’s inside:
- The S&P 500 has lost momentum following the post ‘Brexit’ V-shaped recovery
- But has yet to fill the gap prior to the UK outcome
- Short-term chart points bullish, support and resistance outlined
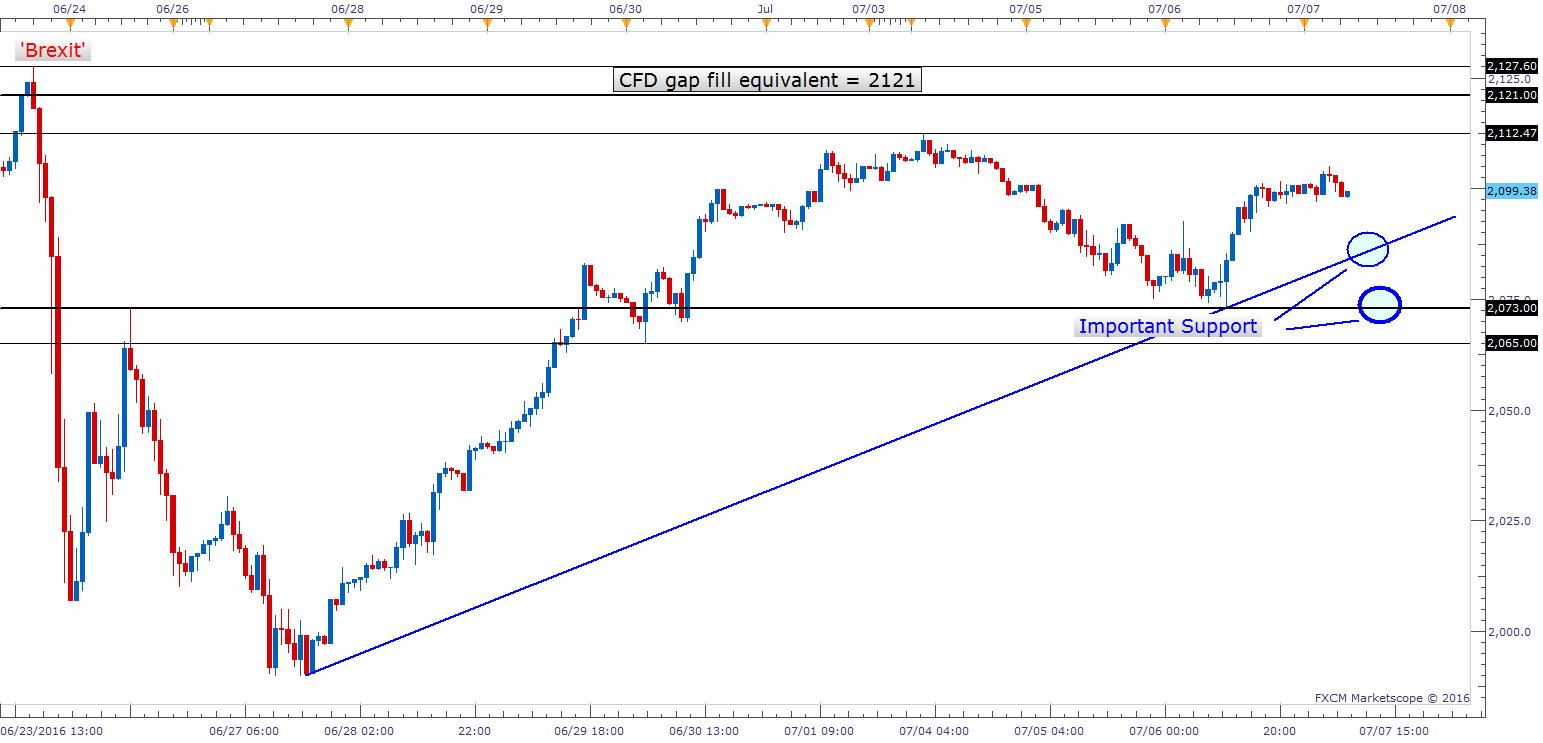
The S&P 500 has struggled to make further gains in recent sessions after the initial portion of the V-shaped recovery following the ‘Brexit’ vote. On June 24, the S&P futures gapped sharply lower from the SPX500 CFD price level of 2121. Given how far the market has come and its propensity to fill major gaps, it looks as though a full gap-fill is in store at the least. From there, the market faces a lot of overhead resistance before it can continue to push higher.
One step at a time.
Looking at the hourly time-frame, the trend trend-line off the 6/27 low comes in as near-term support, with a break below bringing yesterday’s low at 2073 into focus. As long as the market can maintain above either or both the before mentioned support levels then the near-term trend remains intact. A break below the trend-line would not set off alarms for longs, but a decline below 2073 will, as a lower low will be developing.
Resistance currently comes in at the July 4 holiday session high of 2112. Beyond that level a move to the gap fill at 2121 and pre- ‘Brexit’ swing high at 2127 becomes likely.
SPX500 Hourly
Heads up: Tomorrow, we have the monthly US jobs report due out at 12:30 GMT time. Expectations are for a rebound from the poor May NFP number of only +38k. Analyst are looking for the economy to have added 180k jobs during the month, while unemployment is expected to tick higher to 4.8% from 4.7% in May. The market will also be watching the Average Hourly Earnings figure – a gauge for inflation – expectations are for an increase to 2.7% from 2.5%.
Check out our Q3 forecasts for FX, commodities, and global stock markets.
---Written by Paul Robinson, Market Analyst
You can follow Paul on Twitter at @PaulRobinsonFX.
He can be emailed directly at instructor@dailyfx.com with any questions, comments, or concerns.


