


What’s inside:
- Market goes from yearly high to 3+ month lows
- Damaging price action more broadly speaking
- In the short-term charts are mangled, period of digestion will do some good
Friday’s extreme moves toward risk aversion took the S&P 500 from a new yearly high (almost record high) to new 3+ month lows. All the ‘slop-n-chop’ price action in recent months was wiped away in one fell swoop. The charts have effectively been wrecked in the short-term. From a risk/reward perspective it is difficult to make any immediate moves beyond a very short-term time horizon (intra-day).
It will take a little time to find clarity, but a period of digestion will do some good. There will be much to be learned in any retracement which unfolds, whether it begins from current levels or lower. There will soon be some type of retracement, but will it garner market confidence or act more in line with an oversold bounce leading to further weakness?
We lean towards the latter more than the former, but it certainly is still up in the air when looking out over the next 1 to 3 weeks. Longer-term, it appears US markets along with even weaker postured global markets, are headed towards another sizable decline in the second half of the year.
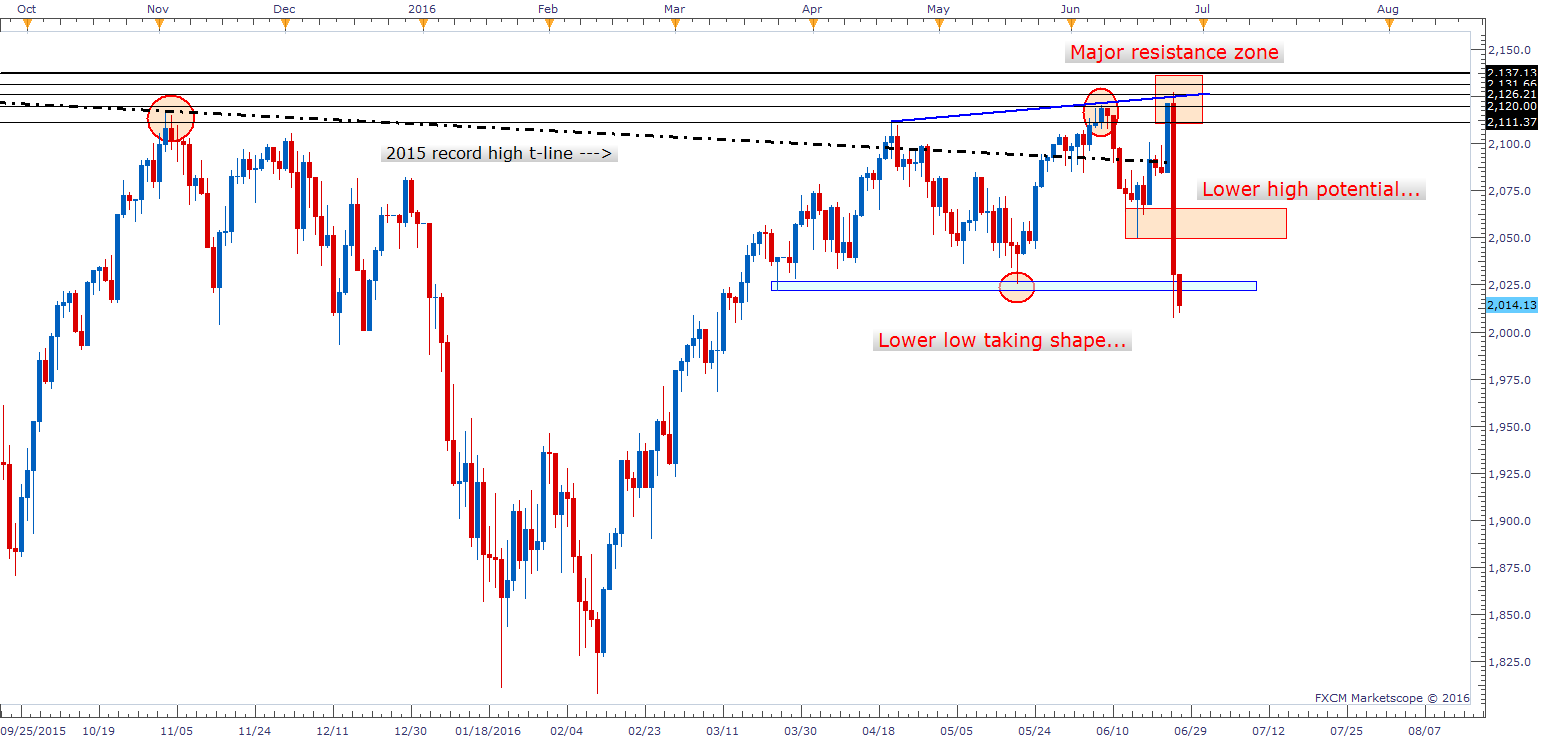
On Friday, the SPX made a lower low from mid-June on a closing basis and a lower low from May on an intra-day basis, but still closed above the 5/19 pivot. For the chart to begin pointing more decisively down after failing near old record highs, a lower low from May would go a long way towards undermining its posturing on the daily/weekly chart. Any snapback rally towards the 2050/70 vicinity will be watched closely for signs of rolling over and creating a lower high.
SPX500
Start improving your analytical and trading skills today with of our many free trading guides.
---Written by Paul Robinson, Market Analyst
You can follow Paul on Twitter at @PaulRobinsonFX


