


To receive James Stanley’s analysis directly via email, please SIGN UP HERE
Talking Points:
- S&P 500 Technical Strategy: Long, two targets hit, one remains.
- US stocks have continued their top-side trajectory, but resistance at current levels highlights the necessity of patience.
- If you’re looking for trading ideas, check out our Trading Guides. And if you want something more short-term in nature, check out our SSI indicator.
In our last article we looked at a long entry off of the 2,040 support level in the S&P 500. Within a day of publishing, that support hit came in and since then prices have ratcheted up to fresh 2016 highs.
With two targets hit, this can be an opportune time to adjust stops to break-even, and moving forward recent price action structure can assist in future entries.
Of interest for near-term price action on the S&P is the Fibonacci level located at 2,065.45, which is the 23.6% retracement of the prior major move (taking the 2,137 high to the 1,833.50 low set on China’s ‘Black Monday’). Perhaps more interesting than this being a Fibonacci level is the fact that numerous support/resistance inflections have taken place around this value. Should price action move lower to find support at 2,065, traders can investigate additional top-side entries. But key will be support actually showing there, as in, traders would want to wait for a wick on the under-side of price action to indicate that buyers are actually responding to the level, and buying to support 2,065.45. If no wick shows on the hourly or 4-hour charts through 2,065.45, traders should approach more cautionsly given the absence of confirmation of support, instead waiting to get an entry at a lower level (perhaps even another entry at 2,040).
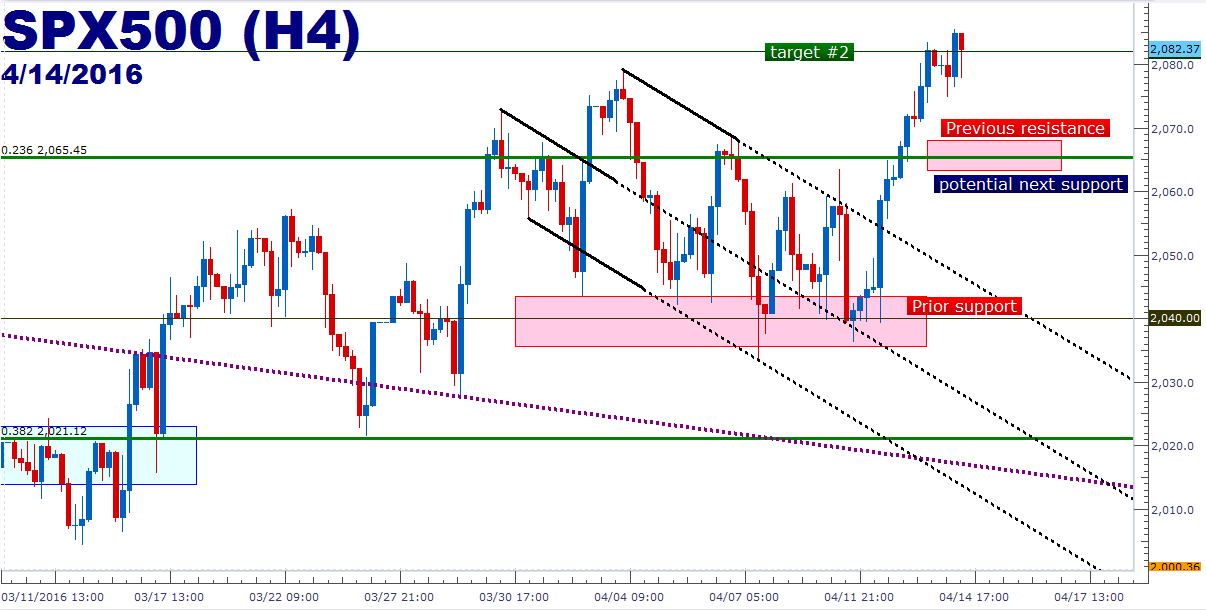
Created with Marketscope/Trading Station II; prepared by James Stanley
--- Written by James Stanley, Analyst for DailyFX.com
To receive James Stanley’s analysis directly via email, please SIGN UP HERE
Contact and follow James on Twitter: @JStanleyFX


