


To receive James Stanley’s analysis directly via email, please SIGN UP HERE
Talking Points:
- S&P 500 Technical Strategy: Flat, long and short setups available depending on bias
- S&P 500 has continued running higher as more bad US data alludes to looser policy for longer out of the United States
- With FOMC on the docket for Wednesday, combined with multiple major economies already alluding to loosening of policy; the S&P 500 could see significant volatility over the next two weeks.
In our last article, we looked at a short setup as the S&P 500 was hitting resistance in a very familiar price area. Amazingly, this setup worked to the first target of 2,000, which is astounding considering the amount of strength that we’ve seen in global stocks over the past two weeks. In that article, we posited that resistance at 2,021 could open the door for reversal setups to the short-side, as this had provided three days of resistance after serving as the ‘FOMC-top’ during the September Federal Reserve meeting. This level was also the 61.8% Fibonacci extension of the 2015 move in the S&P, taking the high of 2137 to the ‘panic lows’ of China’s ‘Black Monday,’ at 1833.50.
After publishing that article, the S&P moved down to a low of 1,990, missing the secondary target by a mere five points before support came into the market and prices rocketed higher. The big driver was, oddly, really bad data. As more bad data came into the market the week before last, particularly out of China, equity markets continued their ‘risk-on’ rally under the assumption that the Federal Reserve wouldn’t be hiking rates in 2015 in light of the numerous developments pointing to a global economic slowdown. After a higher-low was established at 1,990, prices on the S&P ratcheted higher to finally break through that 2,021 level, only to find resistance at another price area on the S&P of 2,040. This had previously been the ‘range low’ for the year 2015 in the S&P 500, until hawkish Fed minutes from the August meetings repelled markets lower.
The swing-high at 2,040 offered two days’ worth of resistance last week until we got to Thursday’s ECB meeting, in which the European Central Bank told markets that they’d ‘re-examine’ their QE-outlay at their December meeting, which was largely construed that the ECB was going to increase QE. Risk assets catapulted higher, and just a day later we got a surprise interest rate and reserve-requirement cut out of China, further prodding prices even higher.
The near-term trend on the S&P is undeniably bullish, as we’re up 10.7% since the end of September (when a low of 1,870 was set on September 29th); but much of this is built on the precipice that the Federal Reserve is going to back away from a 2015 rate hike, which we don’t quite know yet. As a matter of fact, the higher the S&P moves, the more likely the Fed might look at a quicker-than-expected rate hike. We hear from the Fed on Wednesday, and if they, in fact, back off of a 2015 rate hike or take a more dovish stance towards that premise, we could easily see stock prices tear higher. We’ve caught intra-day support at 2,065, which is the 76.4% Fibonacci retracement of the most recent major move (and the move that’s provided consistent support resistance at the 38.2%, 50%, and 61.8% retracement levels). This could provide support for near-term long positions, and traders can even look to lodge stops a little lower below 2,060 to get underneath the Friday low for top-side momentum plays. For traders looking to manage risk more conservatively, stops could be set below that 2,040 prior price action swing high. Near-term targets could be set at 2,100, 2125 (both psychological levels) and then 2,137 (the all-time high).
Alternatively, there are a couple of different ways to take a bearish stance on the S&P given the current setup. Shorter-term horizons could look at near-term resistance at either 2,080 or 2,100 for a reversal play to the short-side. For this manner of entry, targets would be appealing at 2,040, 2021 (61.8% Fib of the most recent major move), and then 2000 (major psychological level).
Traders with a longer time horizon, or for those trying to catch ‘the big short,’ could cast stops above the all-time high of 2,137 to take on ~65 handles of risk; with targets cast towards 1985 (50% Fib retracement of the most recent major move), 1,949 (38.2% of the most recent major move, and significant prior price action support/resistance), 1,905 (the 23.6% retracement), and then 1,833.5 (the 2015 low).
Click below for larger image
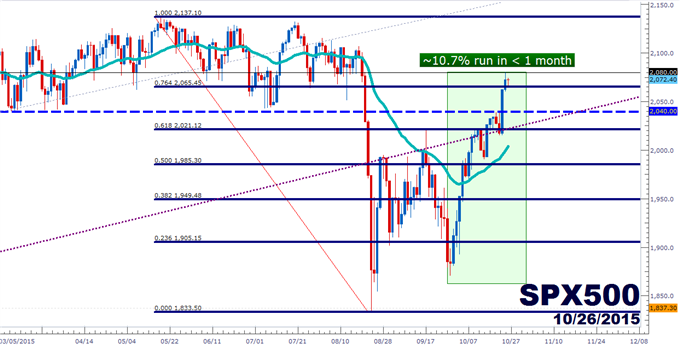
Created with Marketscope/Trading Station II; prepared by James Stanley
--- Written by James Stanley, Analyst for DailyFX.com
To receive James Stanley’s analysis directly via email, please SIGN UP HERE
Contact and follow James on Twitter: @JStanleyFX


