


New Zealand Dollar Technical Price Outlook: NZD/USD Near-term Trade Levels
- New Zealand Dollar updated technical trade levels - Daily & Intraday Charts
- NZD/USD rallies eight of the last nine-sessions – US Non-Farm Payrolls on tap
- Risk for inflection into resistance 7093-7121 – Constructive above 6969 near-term
The New Zealand Dollar surged 0.85% against the US Dollar since the start of the week with NZD/USD attempting to mark a fourth consecutive daily advance. The rally is now approaching the first major resistance hurdles ahead of major US event risk into the close of the week. These are the updated targets and invalidation levels that matter on the NZD/USD technical charts heading into the September open / NFP. Review my latest Strategy Webinar for an in-depth breakdown of this Kiwitrade setup and more.
New Zealand Dollar Price Chart – NZD/USD Daily
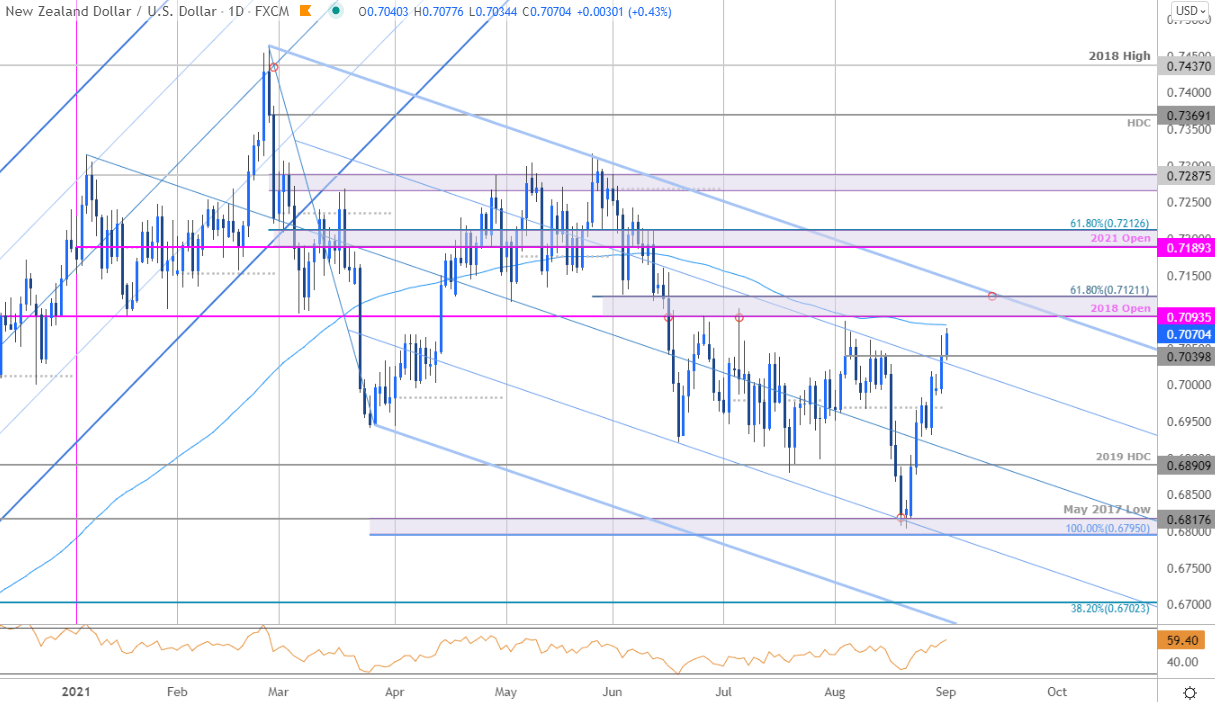
Chart Prepared by Michael Boutros, Technical Strategist; NZD/USD on Tradingview
Technical Outlook: The New Zealand Dollar reversed sharply off confluent support last month at 6795-6817- a region defined by the 100% extension of the decline off the yearly high and the May 2017 low. Kiwi rallied a full 4% off that low with a “V” shaped recovery taking price back towards the August highs. Initial daily resistance is eyed at the 100-day moving average at 7077 backed closely by the 2018 open / 61.8% Fibonacci retracement at 7093-7121 – looking for a larger reaction there IF reached with a breach / close above the yearly open / 61.8% retracement at 7189-7212 needed to suggest a more significant low was registered last month.
New Zealand Dollar Price Chart – NZD/USD 240min

Notes: A closer look at Kiwi price action shows NZD/USD trading within a proposed ascending pitchfork formation extending off the August lows with the 75% parallel further highlighting the 7096-7121 resistance zone. Weekly open support rests at 6993 with a break below the August open at 6969 needed to threaten a deeper pullback here. Key support / bullish invalidation now raised to 6890.

Bottom line: A rebound off key support now takes NZD/USD into a major resistance pivot with the September opening-range taking shape just below. From at trading standpoint, look to reduce long-exposure / raise protective stops on a stretch into 7093-7121 – losses should be limited to the monthly open at 6969 IF price is heading higher with a breach / close above 7121 needed to fuel the next leg higher in price. Review my latest New Zealand Dollar Price Outlook for a closer look at the longer-term NZD/USD weekly technical trading levels.
For a complete breakdown of Michael’s trading strategy, review his Foundations of Technical Analysis series on Building a Trading Strategy
New Zealand Dollar Trader Sentiment – NZD/USD Price Chart

- A summary of IG Client Sentiment shows traders are net-short NZD/USD - the ratio stands at -1.66 (37.63% of traders are long) – typically bullish reading
- Long positions are 1.13% lower than yesterday and 23.77% lower from last week
- Short positions are 0.23% lower than yesterday and 1.80% lower from last week
- We typically take a contrarian view to crowd sentiment, and the fact traders are net-short suggests NZD/USD prices may continue to rise. Traders are further net-short than yesterday and last week, and the combination of current positioning and recent changes gives us a stronger NZD/USD-bullish contrarian trading bias from a sentiment standpoint.
Key New Zealand / US Economic Releases

Economic Calendar - latest economic developments and upcoming event risk.
Active Technical Setups
- Gold Price Outlook: Gold Rally Stalls at Resistance- XAU/USD Levels
- Canadian Dollar Outlook: USD/CAD Plunge Searches Support- Loonie Levels
- Bitcoin Outlook: BTC/USD Breakout Stalling- Crypto Technicals Levels
- Euro Price Outlook: EUR/USD Plunge Targets Key Support at 2021 Low
--- Written by Michael Boutros, Technical Currency Strategist with DailyFX
Follow Michael on Twitter @MBForex


