


New Zealand Dollar, NZD/USD, NZD/JPY, GBP/NZD, Technical Analysis – Talking Points:
- NZD/USD poised to extend gains as prices remain constructively perched above key support.
- NZD/JPY rates eyeing a push to fresh yearly highs.
- GBP/NZD at risk of further losses after collapsing through long-term trend support.
The cyclically-sensitive New Zealand Dollar looks set to extend its climb higher against its major counterparts, as multiple bullish technical setups begin to take place on several NZD crosses. Here are the key levels to watch for NZD/USD, NZD/JPY and GBP/NZD rates.
NZD/USD Daily Chart – Poised to Extend Gains

NZD/USD daily chart created using Tradingview
NZD/USD rates may continue to push higher in the near term, as prices remain constructively perched above the psychologically pivotal 0.7000 mark and key support at the June 2018 high (0.7060).
With the RSI climbing back into overbought territory, and the MACD indicator hovering at its highest levels since late June, the path of least resistance remains skewed to the topside.
A daily close above the December 14 high (0.7120) would probably propel prices to probe resistance at the 50% Fibonacci (0.7172). Clearing that likely brings psychological resistance at 0.7200 into focus.
Alternatively, slipping back below 0.7050 could trigger a pullback towards the monthly low (0.7006), with a break below clearing a path for price to challenge confluent support at the 38.2% Fibonacci (0.6955) and Ascending Channel resistance-turned-support.
NZD/JPY Daily Chart – Eyeing Push to Fresh Yearly Highs
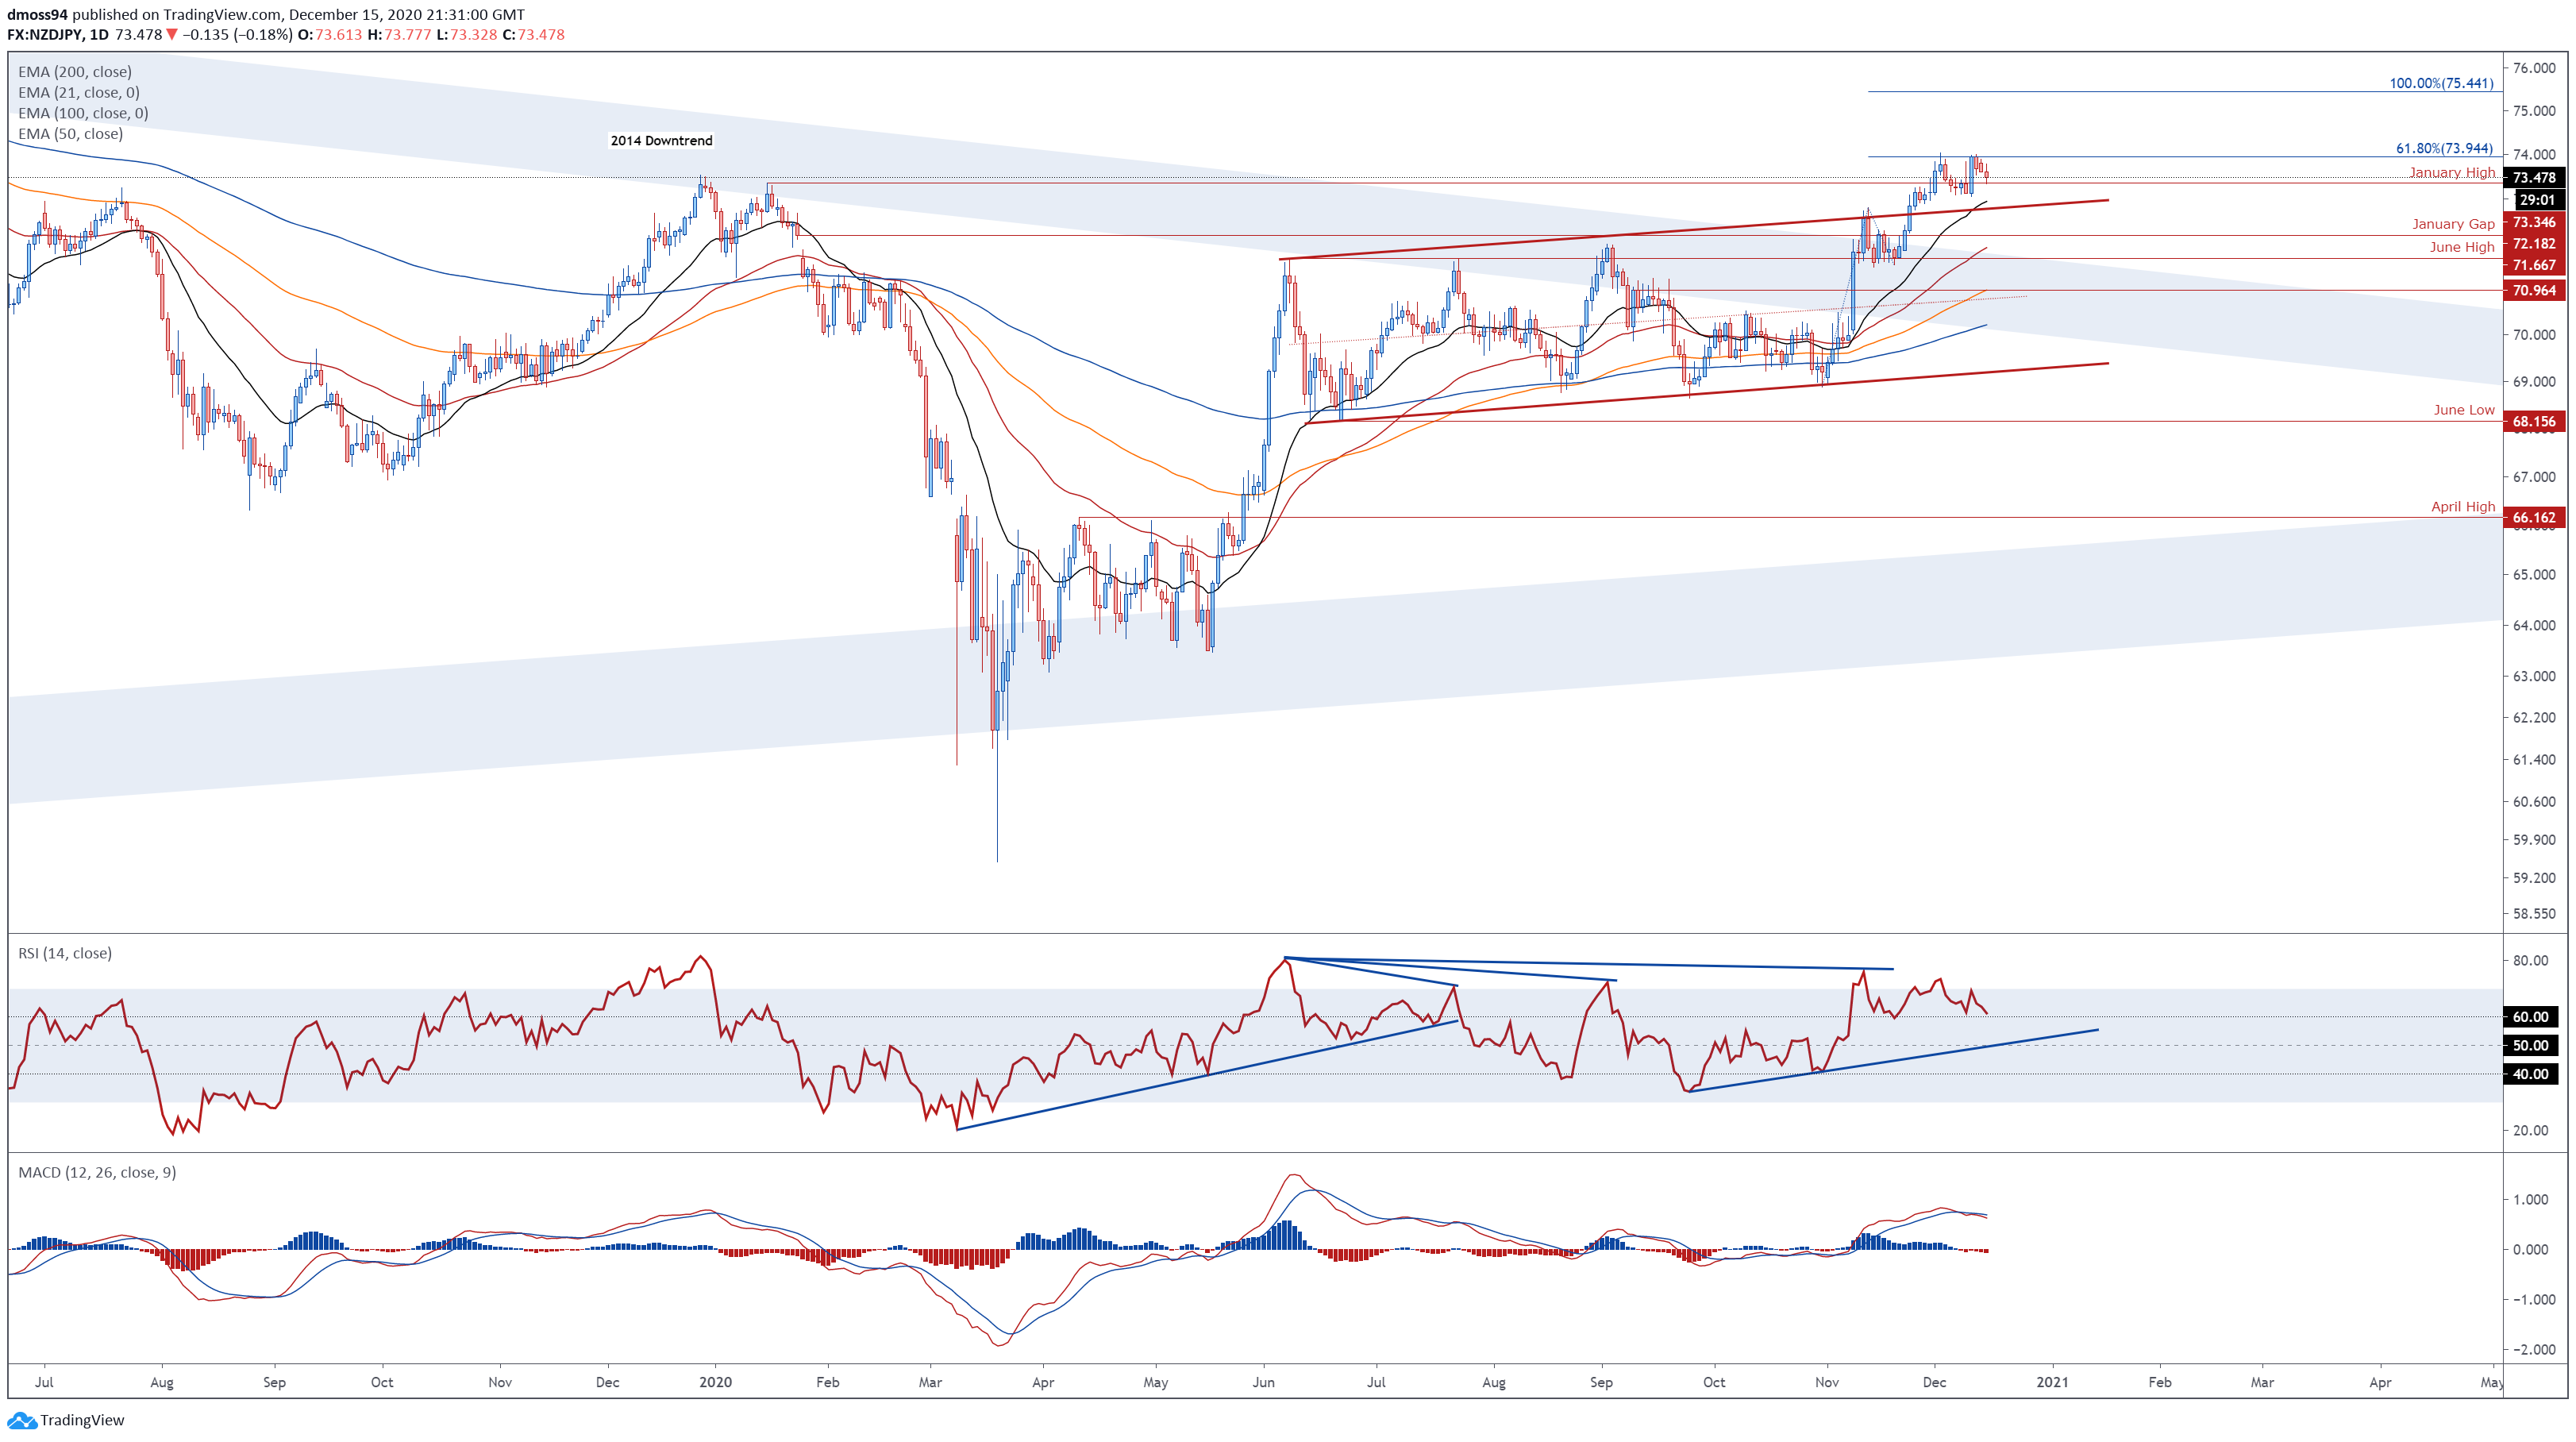
NZD/JPY daily chart created using Tradingview
NZD/JPY rates also seem poised to extend recent gains, as prices continue to track firmly above all four moving averages and key support at the January high (73.35).
With the RSI holding above 60, and the MACD tracking above its neutral midpoint, a more extended topside push seems likely in the near term.
Gaining a firm foothold above the 61.8% Fibonacci (73.94) on a daily close basis would likely signal the resumption of the primary uptrend and clear a path for price to challenge the psychologically imposing 75.00 mark.
Conversely, slicing back below the January high (73.35) could generate a short-term correction towards confluent support at the monthly low (73.04) and the 21-day moving average. Breaching that would probably ignite a more extended pullback and bring the trend-defining 50-DMA into the crosshairs (71.97).
GBP/NZD Daily Chart – Long-Term Trend Break Hints at Further Losses

GBP/NZD daily chart created using Tradingview
GBP/NZD may extend its 14% slide from the yearly high set in March (2.1759), as prices continue to track within the confines of a descending Schiff Pitchfork after collapsing through the uptrend extending from the 2016 lows.
With the RSI adhering to the downtrend extending from the August extremes, and the MACD travelling at its lowest levels since September, further losses look likely in the near term.
Failure to push back above the 78.6% Fibonacci (1.9024) would probably allow sellers to regain control of the exchange rate and drive it back towards the November low (1.8896). Hurdling that likely carves a path for prices to close the December 13 gap open (1.8643).
On the contrary, GBP/NZD may continue to claw back lost ground if prices remain constructively perched above the pitchfork median line, with a daily close above the 21-DMA (1.8999) potentially generating a topside push to test the monthly high (1.9188).
-- Written by Daniel Moss, Analyst for DailyFX
Follow me on Twitter @DanielGMoss


