


NZD/USD Technical ANALYSIS: BEARISH
- New Zealand Dollar on pace for the longest losing streak in 4 months
- Positive RSI divergence hints prices may bounce from an 11-year low
- Sentiment studies offer mixed signals, leave door open to retracement
The New Zealand Dollar is working on the fifth consecutive day of losses against its US counterpart, a losing streak that would make for the worst performance in four months. A break below the 78.6% Fibonacci expansion at 0.5995 appears to initially expose the 100% level at 0.5872. Alternatively, a move back above 0.5995 – now recast as resistance – may set the stage for a retest of the 61.8% Fib at 0.6092.
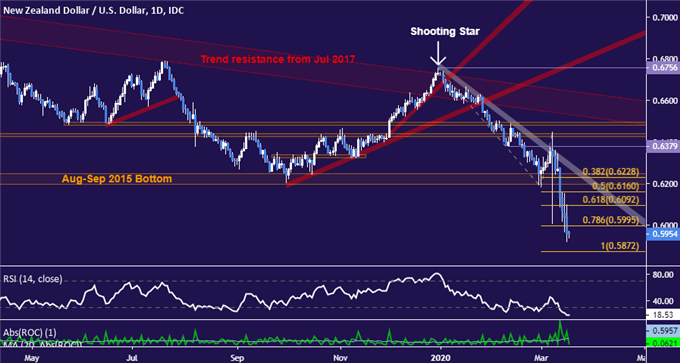
NZD/USD daily chart created using TradingView
Zooming in to the four-hour chart warns that downside follow-though may not be as readily forthcoming as the daily bar view suggests. The appearance of positive RSI divergence speaks to ebbing downside momentum and warns that a correction upward might be in the cards. Prices probably need to break falling trend line resistance set from the March 9 high to make the case for upside follow-through however.
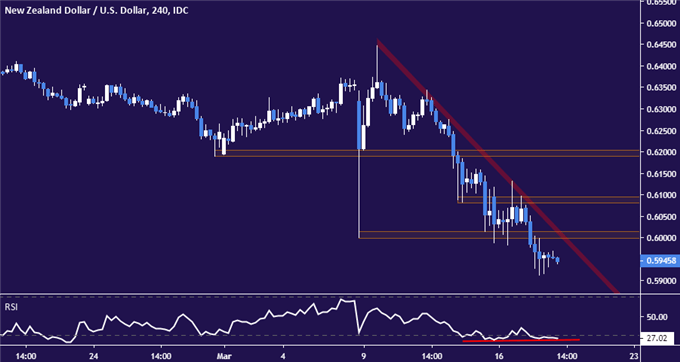
NZD/USD 4-hour chart created using TradingView

NZD/USD TRADER SENTIMENT
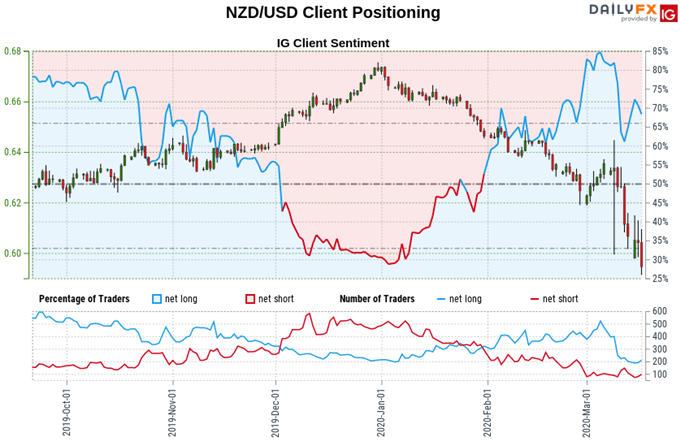
Retail sentiment data shows 66.02% of traders are net-long, with the long-to-short ratio at 1.94 to 1. IG Client Sentiment(IGCS) is typically used as a contrarian indicator, soretail traders being net-long suggests NZD/USD may continue to fall. However, positioningis less net-long than yesterday even though it is moresocompared with last week.This makes for a clouded sentiment-based outlook.
See the full IGCS sentiment report here.

NZD/USD TRADING RESOURCES:
- Just getting started? See our beginners’ guide for FX traders
- Having trouble with your strategy? Here’s the #1 mistake that traders make
- Join a free live webinar and have your trading questions answered
--- Written by Ilya Spivak, Currency Strategist for DailyFX.com
To contact Ilya, use the Comments section below or @IlyaSpivak on Twitter


