


NEW ZEALAND DOLLAR: RBNZ MONETARY POLICY STATEMENT ON TAP & WILL LIKELY STEER SPOT NZD/USD
- NZD price action has succumbed to a flood of risk-aversion that has pushed Kiwi roughly 5% lower on balance against other major currency pairs since the start of the year
- The New Zealand Dollar looks to the RBNZ monetary policy statement slated for release early Wednesday
- NZD/USD appears ripe for a big move according to a spike in implied volatility
The New Zealand Dollar seems set for elevated currency volatility over the next 24-hours in light of high-impact event risk scheduled early during Wednesday’s trading session.
Specifically, the Reserve Bank of New Zealand (RBNZ) is due to release an interest rate decision and accompanying monetary policy statement February 12 at 1:00 GMT.
RBNZ Governor Orr is expected to provide additional commentary on the central bank’s latest leaning and outlook for the New Zealand economy shortly after at 2:00 GMT.
NZD/USD – NEW ZEALAND DOLLAR IMPLIED VOLATILITY CHART (OVERNIGHT)
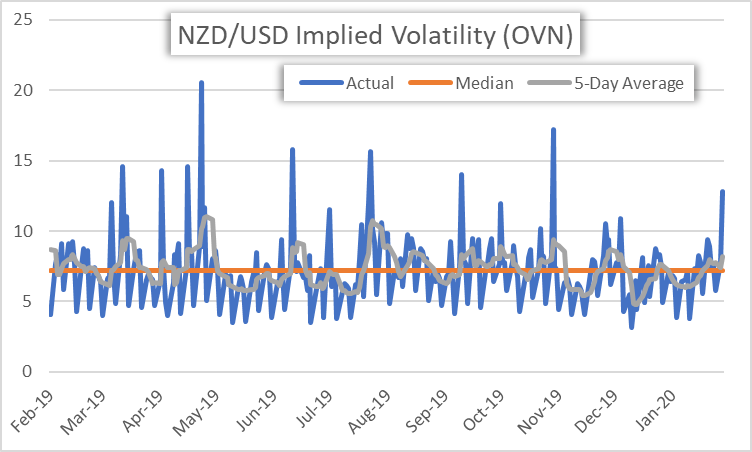
Correspondingly, overnight implied volatility readings on the New Zealand Dollar have skyrocketed as forex options traders gear up for this potentially market moving event.
NZD/USD implied volatility for the overnight tenor was just clocked at 12.8%, which is the highest measurement in 3-months and compares to its 5-day average of 8.2% and 12-month median of 7.2%.
RBNZ – RESERVE BANK OF NEW ZEALAND INTEREST RATE CUT PROBABILITIES CHART

Markets overwhelmingly expect the RBNZ to leave its benchmark interest rate – the Official Cash Rate (OCR) – unchanged at a record-low 1.00% following 75-basis points of cuts last year.
Nevertheless, traders are currently pricing a 70% probability that the central bank will cut the OCR again by the September 23 RBNZ meeting.
The relatively hawkish or dovish guidance from RBNZ Governor Orr and the Monetary Policy Committee is expected to overwhelmingly steer the broader direction of NZD price action in turn.
NZD/USD – NEW ZEALAND DOLLAR RISK REVERSAL CHART (OVERNIGHT)
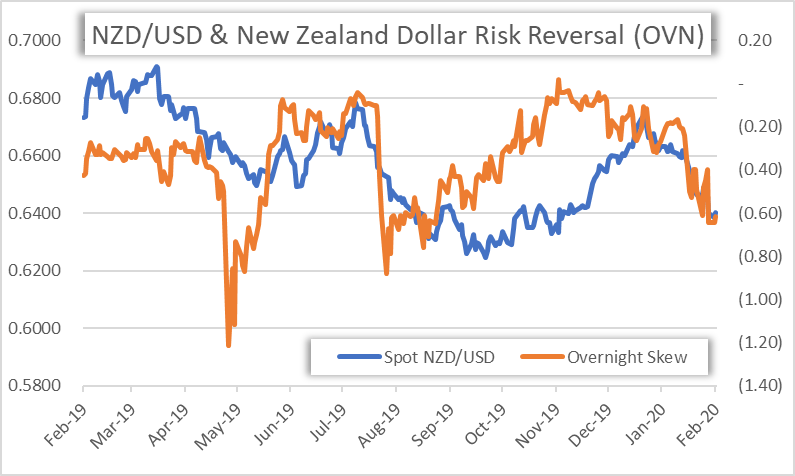
Looking to overnight risk reversals for the New Zealand Dollar we see that NZD/USD options traders have a bearish bias toward the Kiwi on balance.
The latest overnight NZD/USD risk reversal reading of -0.62 is up slightly from the prior day’s reading of -0.65, which marked a fresh 6-month low.
A risk reversal reading above zero indicates that the demand for call option volatility (upside protection) exceeds that of put option volatility (downside protection).
NZD/USD – NEW ZEALAND DOLLAR PRICE CHART TECHNICAL ANALYSIS

That said, spot NZD/USD is estimated to hold an 86-pip trading range in the wake of the RBNZ monetary policy update, which is calculated using the currency pair’s overnight implied volatility of 12.8%.
| Change in | Longs | Shorts | OI |
| Daily | -6% | 14% | -2% |
| Weekly | 14% | -12% | 6% |
Options-implied trading ranges are assumed to encompass spot price action over the specified time frame with a 68% statistical probability.
As such, spot NZD/USD price action is likely to be contained within its 1-standard deviation trading range of 0.6357-0.6443.
These derived support and resistance levels roughly align with technical confluence underpinned by the November 2019 lows and September 2019 highs respectively.
Keep Reading: NZD/USD Looks Vulnerable - How Dovish will the RBNZ Turn?
-- Written by Rich Dvorak, Junior Analyst for DailyFX.com
Connect with @RichDvorakFX on Twitter for real-time market insight


