NZD/USD Technical ANALYSIS: BEARISH
- New Zealand Dollar at 2-month low after trend support break
- Short-term charts hint corrective recovery may be in the cards
- Break above 0.66 might neutralize near-term selling pressure
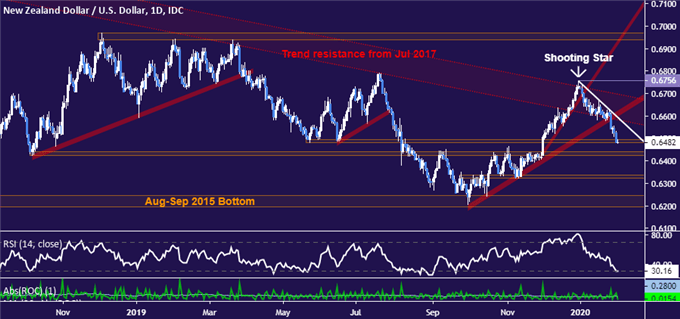
The New Zealand Dollar extended downward against its US counterpart after breaking support guiding the uptrend from October swing lows, as expected. Prices have landed atop support at the outer layer of the 0.6425-96 area congestion area, with sellers attempting to continue to push the exchange rate lower.
Breaking below this barrier’s lower boundary with confirmation on a daily closing basis sets the stage for a challenge of the 0.6322-36 inflection zone. Below that, NZD/USD will face a potent floor marked the 2015 bottom in the 0.6197-0.6245 region.

NZD/USD daily chart created using TradingView


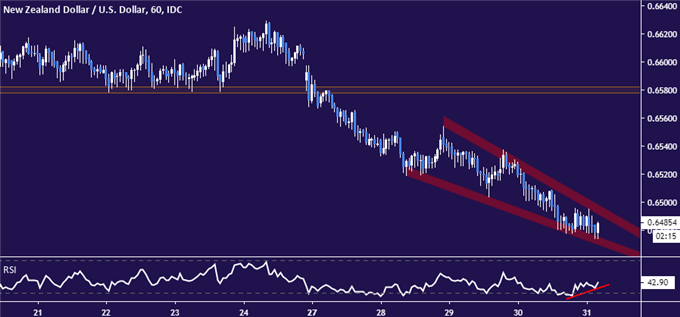
Zooming in to the hourly chart, an earlier hint at a corrective bounce has fizzled without follow-through but the makings of a pull-up may be re-emerging. Price action is tracing out a typically bullish Falling Wedge chart pattern, with added reinforcement from positive RSI divergence.

NZD/USD 60-minute chart created using TradingView
With prices sitting at support and signs of ebbing selling pressure cropping up in near-term positioning, traders might reason that selling into recent losses is unattractive from a risk/reward perspective. If this translates into recovery, initial resistance comes into play in the 0.6578-58 price band.
Looking back at the daily chart, this is reinforced by a falling trend line defining the down move thus far in 2020, currently at 0.6593. A break above that would suggest near-term selling pressure has been neutralized. Closing above resistance from July 2017 is probably needed for lasing upside follow-through however.
NZD/USD TRADER SENTIMENT
| Change in | Longs | Shorts | OI |
| Daily | -9% | -13% | -10% |
| Weekly | -19% | -7% | -16% |
NZD/USD TRADING RESOURCES:
- Just getting started? See our beginners’ guide for FX traders
- Having trouble with your strategy? Here’s the #1 mistake that traders make
- Join a free live webinar and have your trading questions answered
--- Written by Ilya Spivak, Currency Strategist for DailyFX.com
To contact Ilya, use the Comments section below or @IlyaSpivak on Twitter


