


NZD/USD Technical ANALYSIS: BEARISH
- NZ Dollar breaks monthly trend support after rejection at key resistance
- Short-term chart positioning warns sellers may struggle to follow through
- Overall trend bias still bearish absent recovery north of the 0.70 figure

The New Zealand Dollar extended lower as expected after putting in a Shooting Star candlestick at 2.5-year trend resistance and pushing through support guiding December’s month-long rally. Sellers are now flirting with minor resistance-turned-support at 0.6636. A daily close below that opens the door for a descent to challenge the dense 0.6425-96 support zone.

Daily NZD/USD chart created using TradingView
A look at the four-hour chart suggests immediate selling pressure may struggle for follow-through however. Positive RSI divergence has emerged on a test of upward-sloping support set from early December, pointing to ebbing bearish momentum. What follows next may be mere consolidation before liquidation resumes, but a bounce might also materialize.

4-hour NZD/USD chart created using TradingView
Initial resistance is at 0.6680, marked by January’s range top and reinforced by a falling trend line defining the descent from the December 31 high. A close above that would suggest near-term selling pressure has been neutralized. Upending the case for a long-term, structural decline will take more effort however. The monthly chart suggests that would require reclaiming a foothold near the 0.70 figure, above the 2018 high.
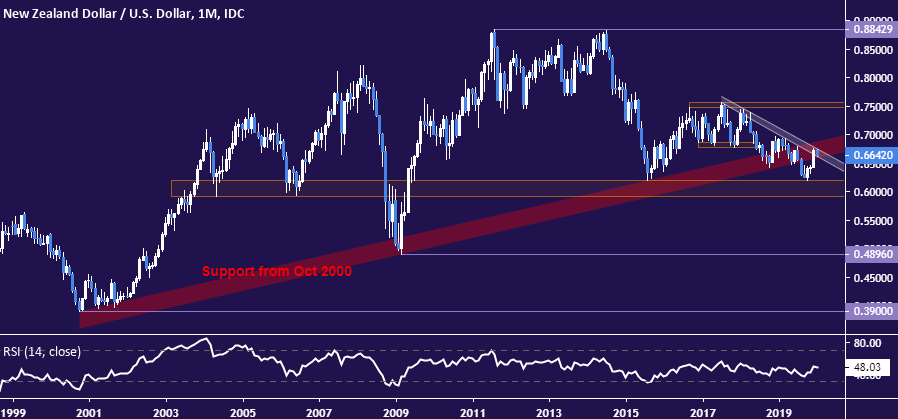
Monthly NZD/USD chart created using TradingView
| Change in | Longs | Shorts | OI |
| Daily | -1% | 4% | 0% |
| Weekly | 24% | -18% | 9% |
NZD/USD TRADING RESOURCES:
- Just getting started? See our beginners’ guide for FX traders
- Having trouble with your strategy? Here’s the #1 mistake that traders make
- Join a free live webinar and have your trading questions answered
--- Written by Ilya Spivak, Currency Strategist for DailyFX.com
To contact Ilya, use the Comments section below or @IlyaSpivak on Twitter


