


NZD/USD Technical ANALYSIS: BEARISH
- NZ Dollar bounces as expected but gains might be cut short
- Indecision, early signs of topping might precede a downturn
- Break of initial support may open the way to test below 0.63
Get help building confidence in your NZD/USD strategy with our free trading guide!
The New Zealand Dollar is back on the offensive against its US counterpart following an expected pullback. The pair is back to testing resistance in the 0.6425-41 area. A break above that confirmed on a daily closing basis would set the stage for a test of the 0.6482-96 zone, completing the rise implied by a Head and Shoulders (H&S) chart pattern carved out between late September and mid-October.
Nevertheless, the dominant trend bias continues to look bearish while prices remain below downward-sloping resistance guiding Kiwi Dollar depreciation since July 2017. Any further near-term gains from here appear to be corrective within that context, at least for now. Breaking below counter-trend support set from October lows – now at 0.6315 – seems like a prerequisite for re-engaging that overall trajectory.
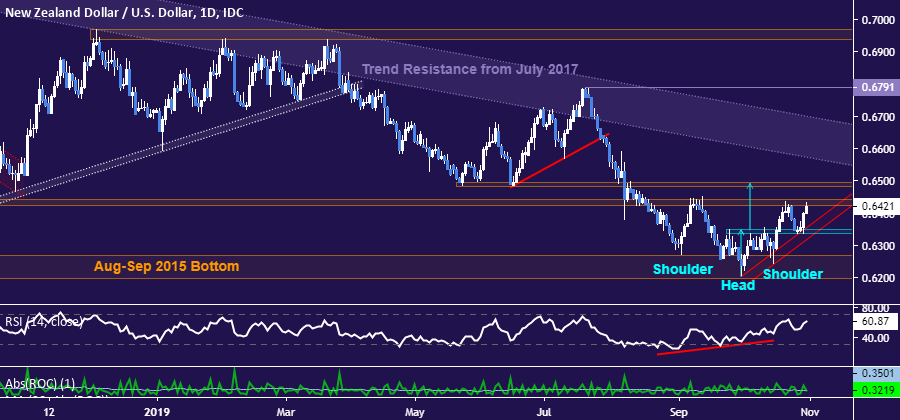
Daily NZD/USD chart created using TradingView
Zooming out to the monthly chart offers a clue about just how deep forthcoming losses might be once sellers retake the initiative. Prices broke through support guiding them higher for the better part of two decades in August, setting the stage for a tectonic bearish pivot. Some hesitation has understandably emerged in the 0.5914-0.6197 region thereafter. It has been an important inflection area since early 2003.
A precipitous drop may follow if this is overcome. In this scenario, there seem to be relatively few hurdles lining up to thwart bearish progress toward 10-year lows below the 0.49 figure. The bar for invaliding long-term selling pressure seems quite high as well. For that, NZD/USD would need to conclusively break the bounds of the downtrend from July 2014. That amounts to a monthly close above 0.6917.

Monthly NZD/USD chart created using TradingView
NZD/USD TRADING RESOURCES:
- Just getting started? See our beginners’ guide for FX traders
- Having trouble with your strategy? Here’s the #1 mistake that traders make
- Join a free live webinar and have your trading questions answered
--- Written by Ilya Spivak, Currency Strategist for DailyFX.com
To contact Ilya, use the Comments section below or @IlyaSpivak on Twitter


